Variance Decomposition
Brief Description
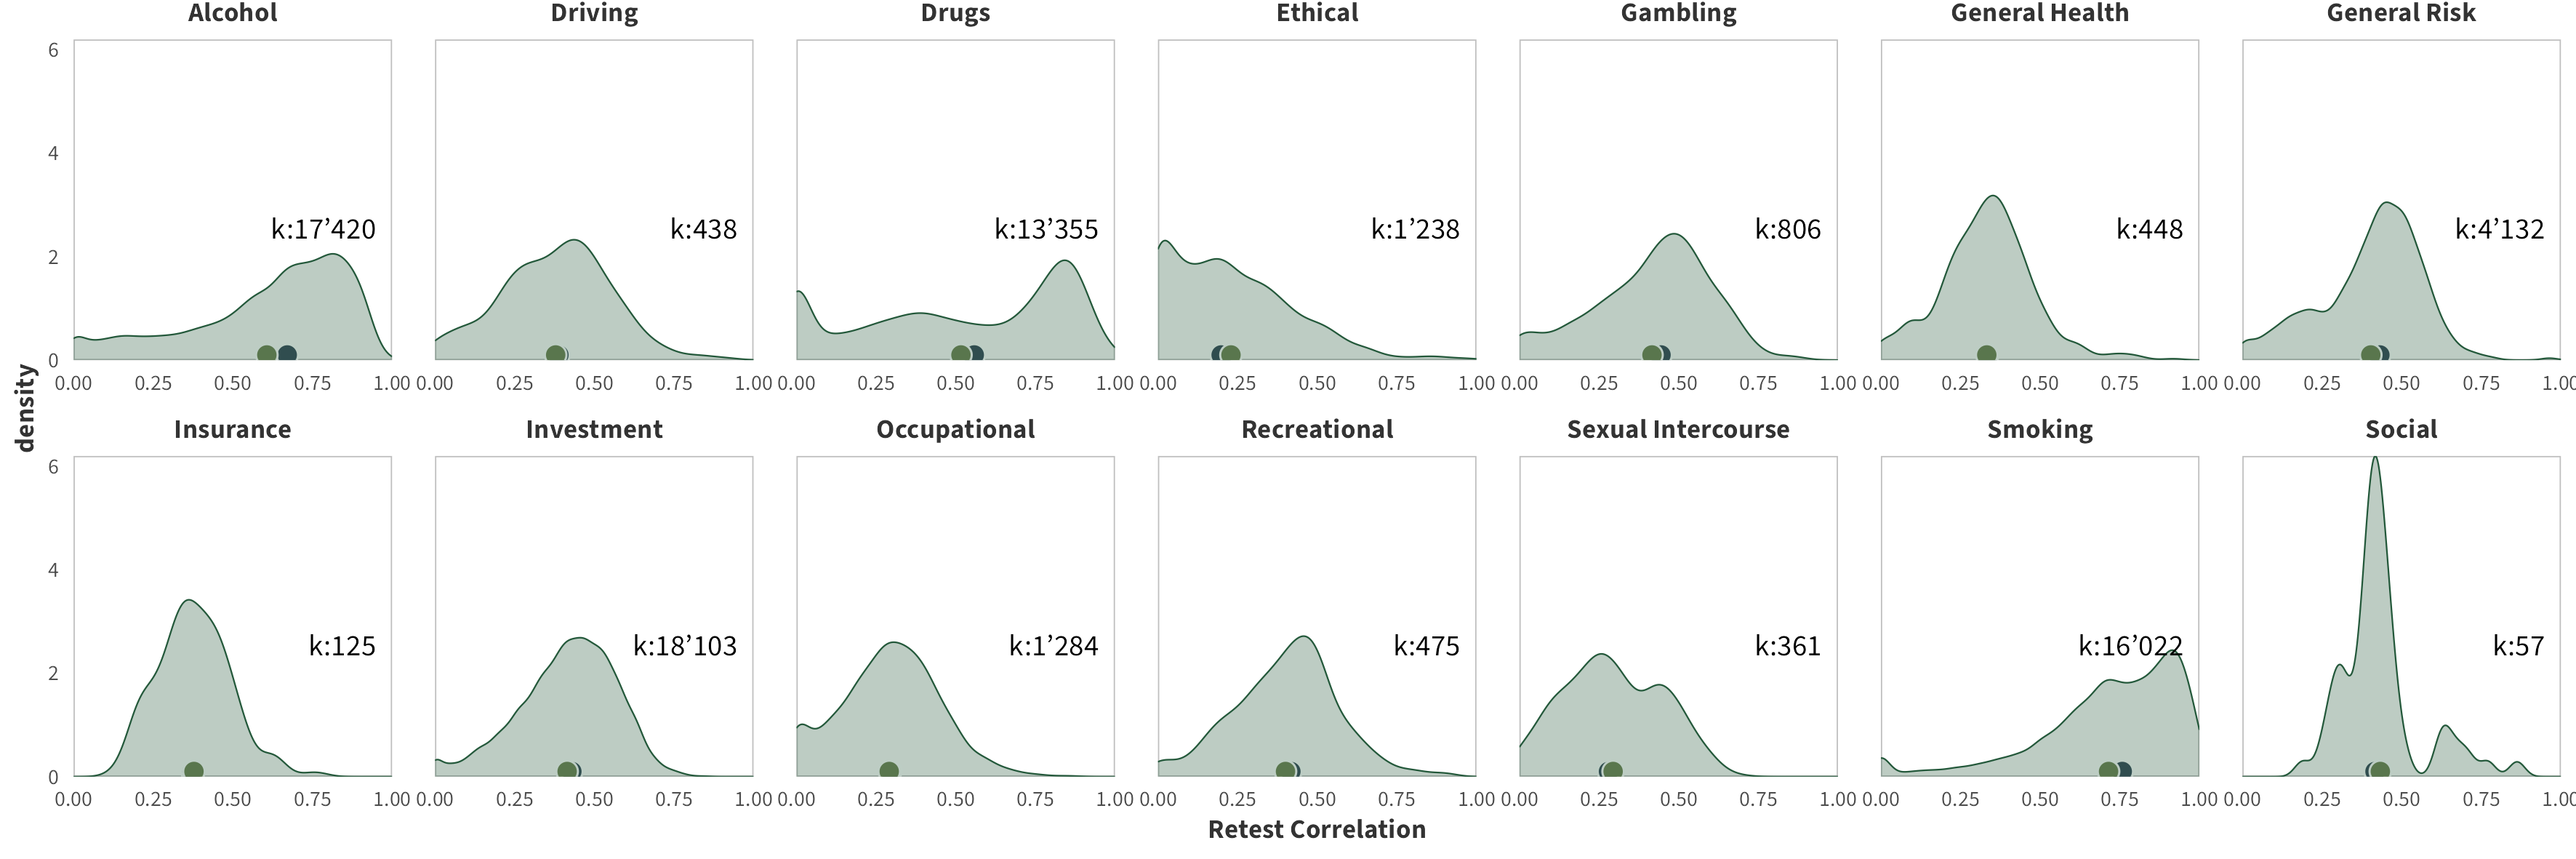
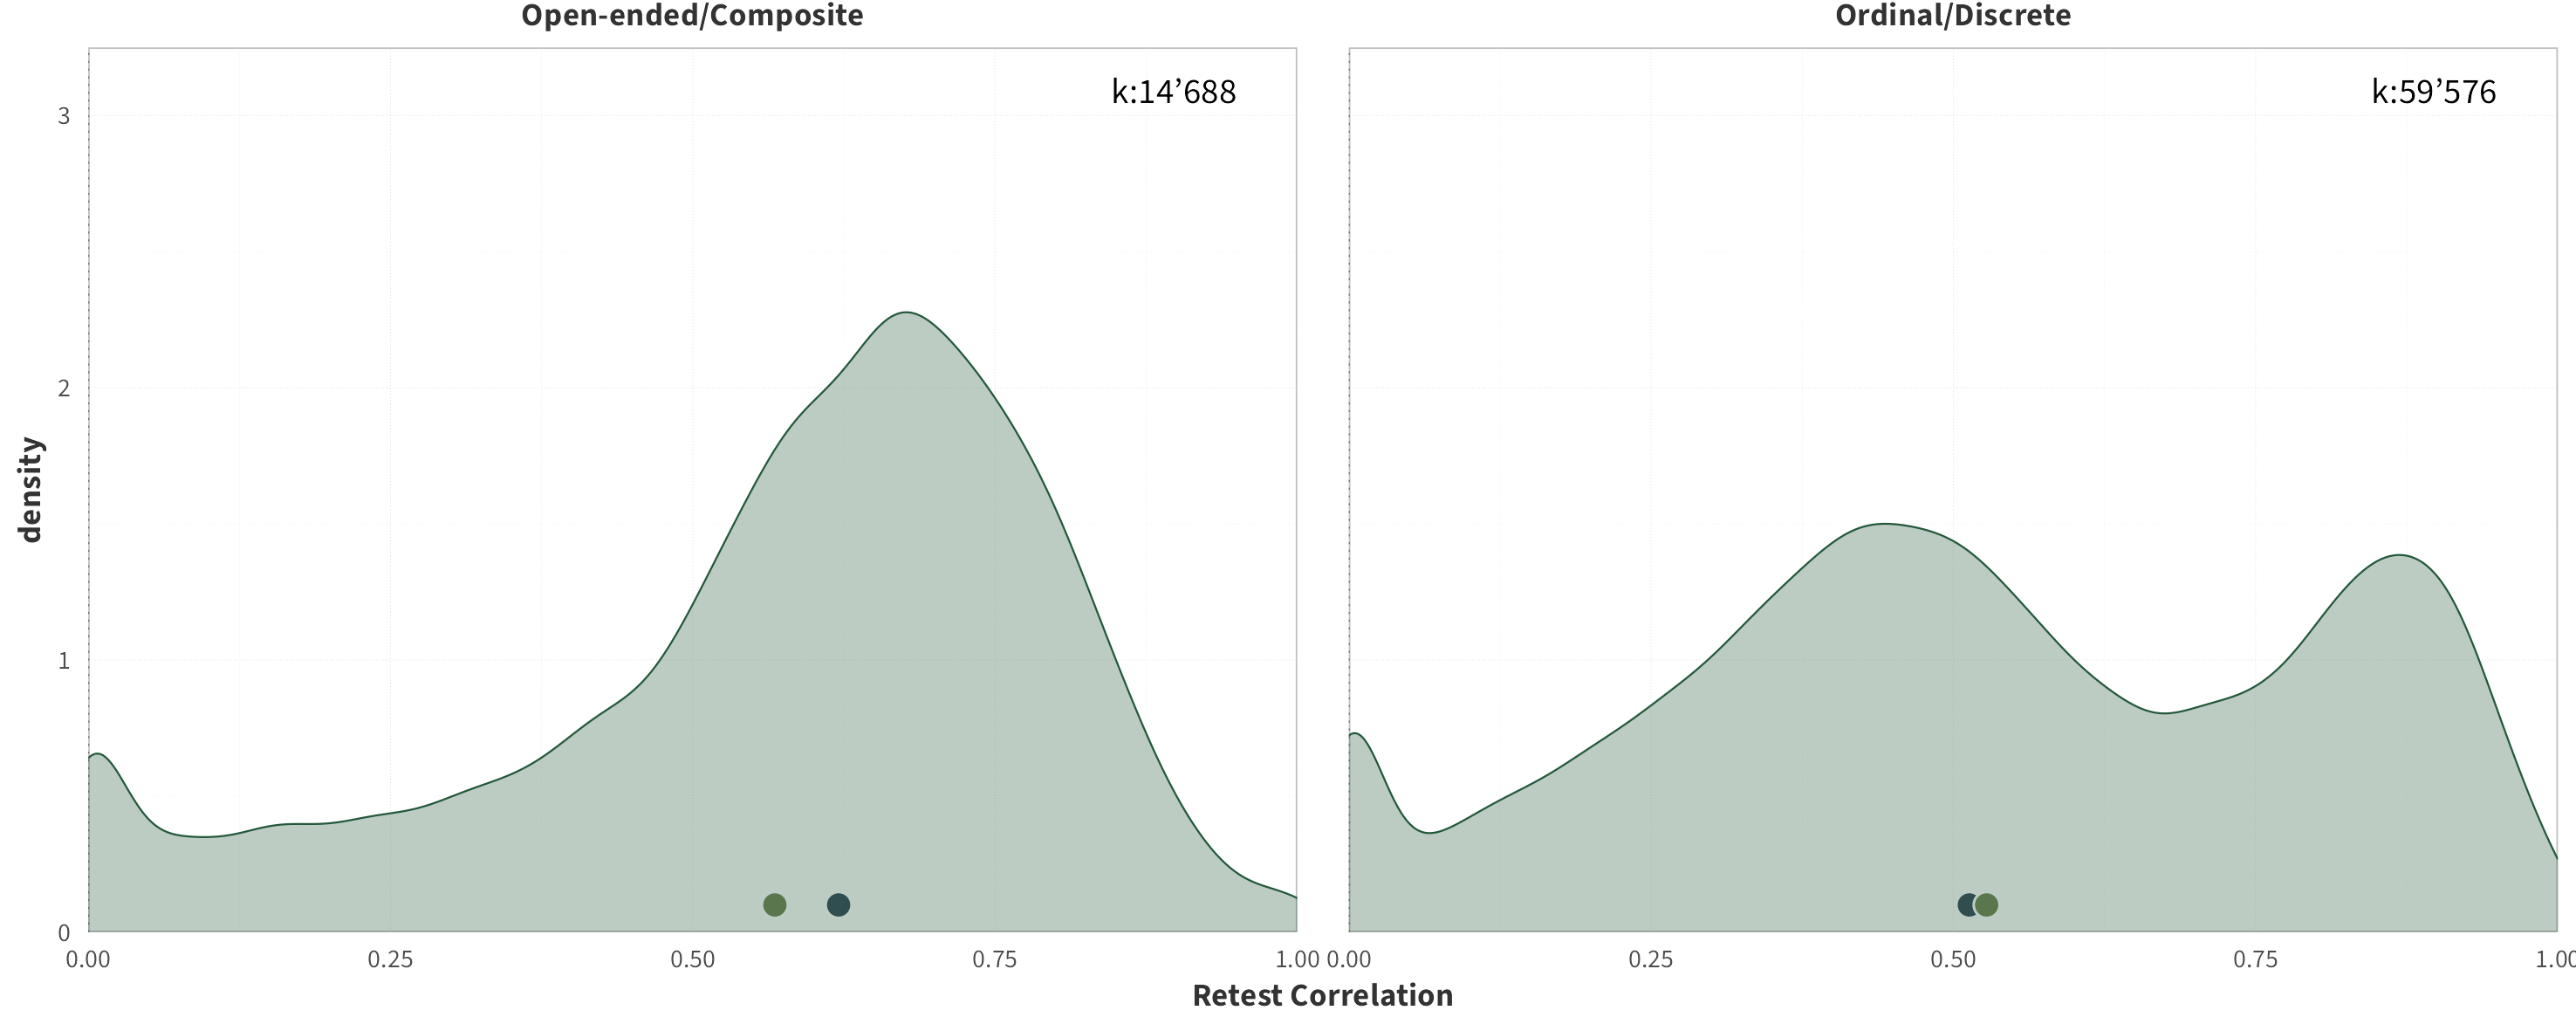
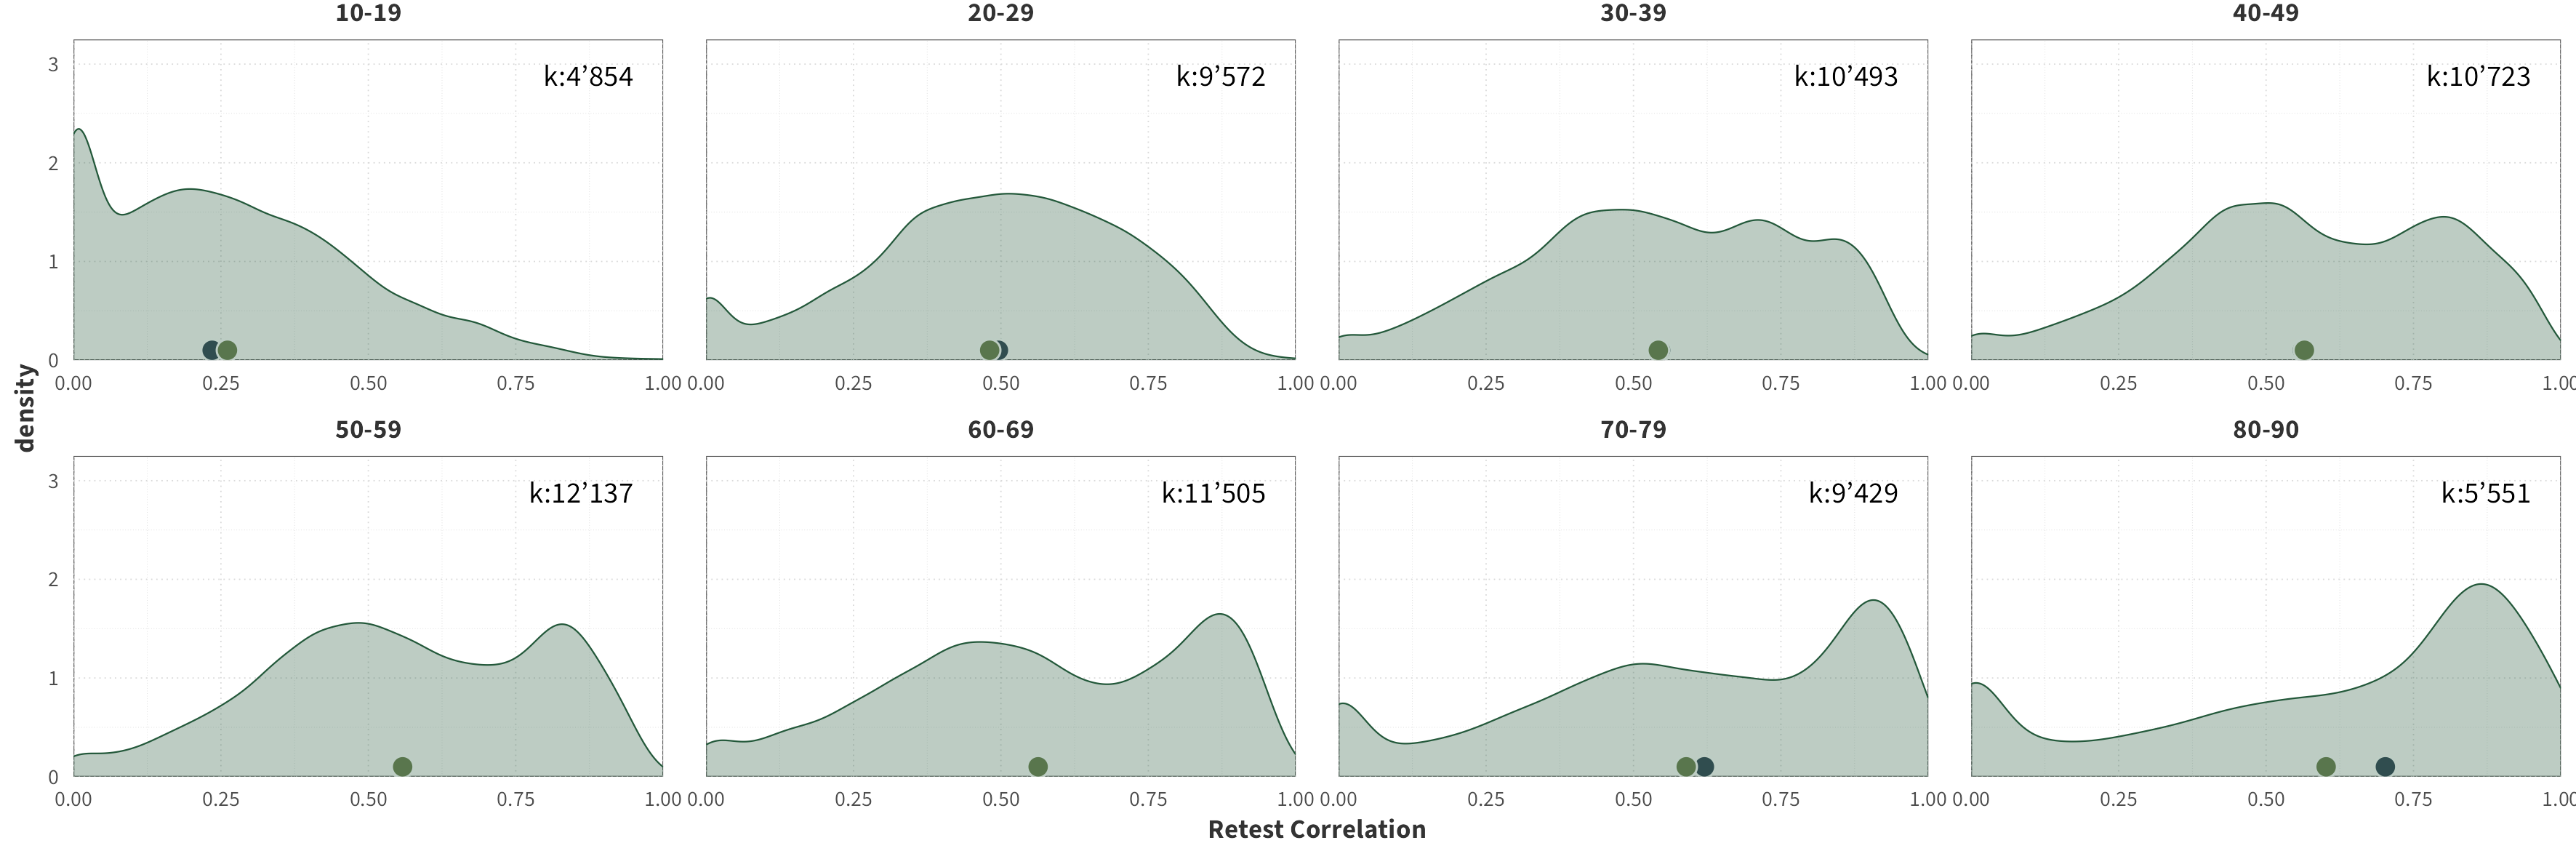
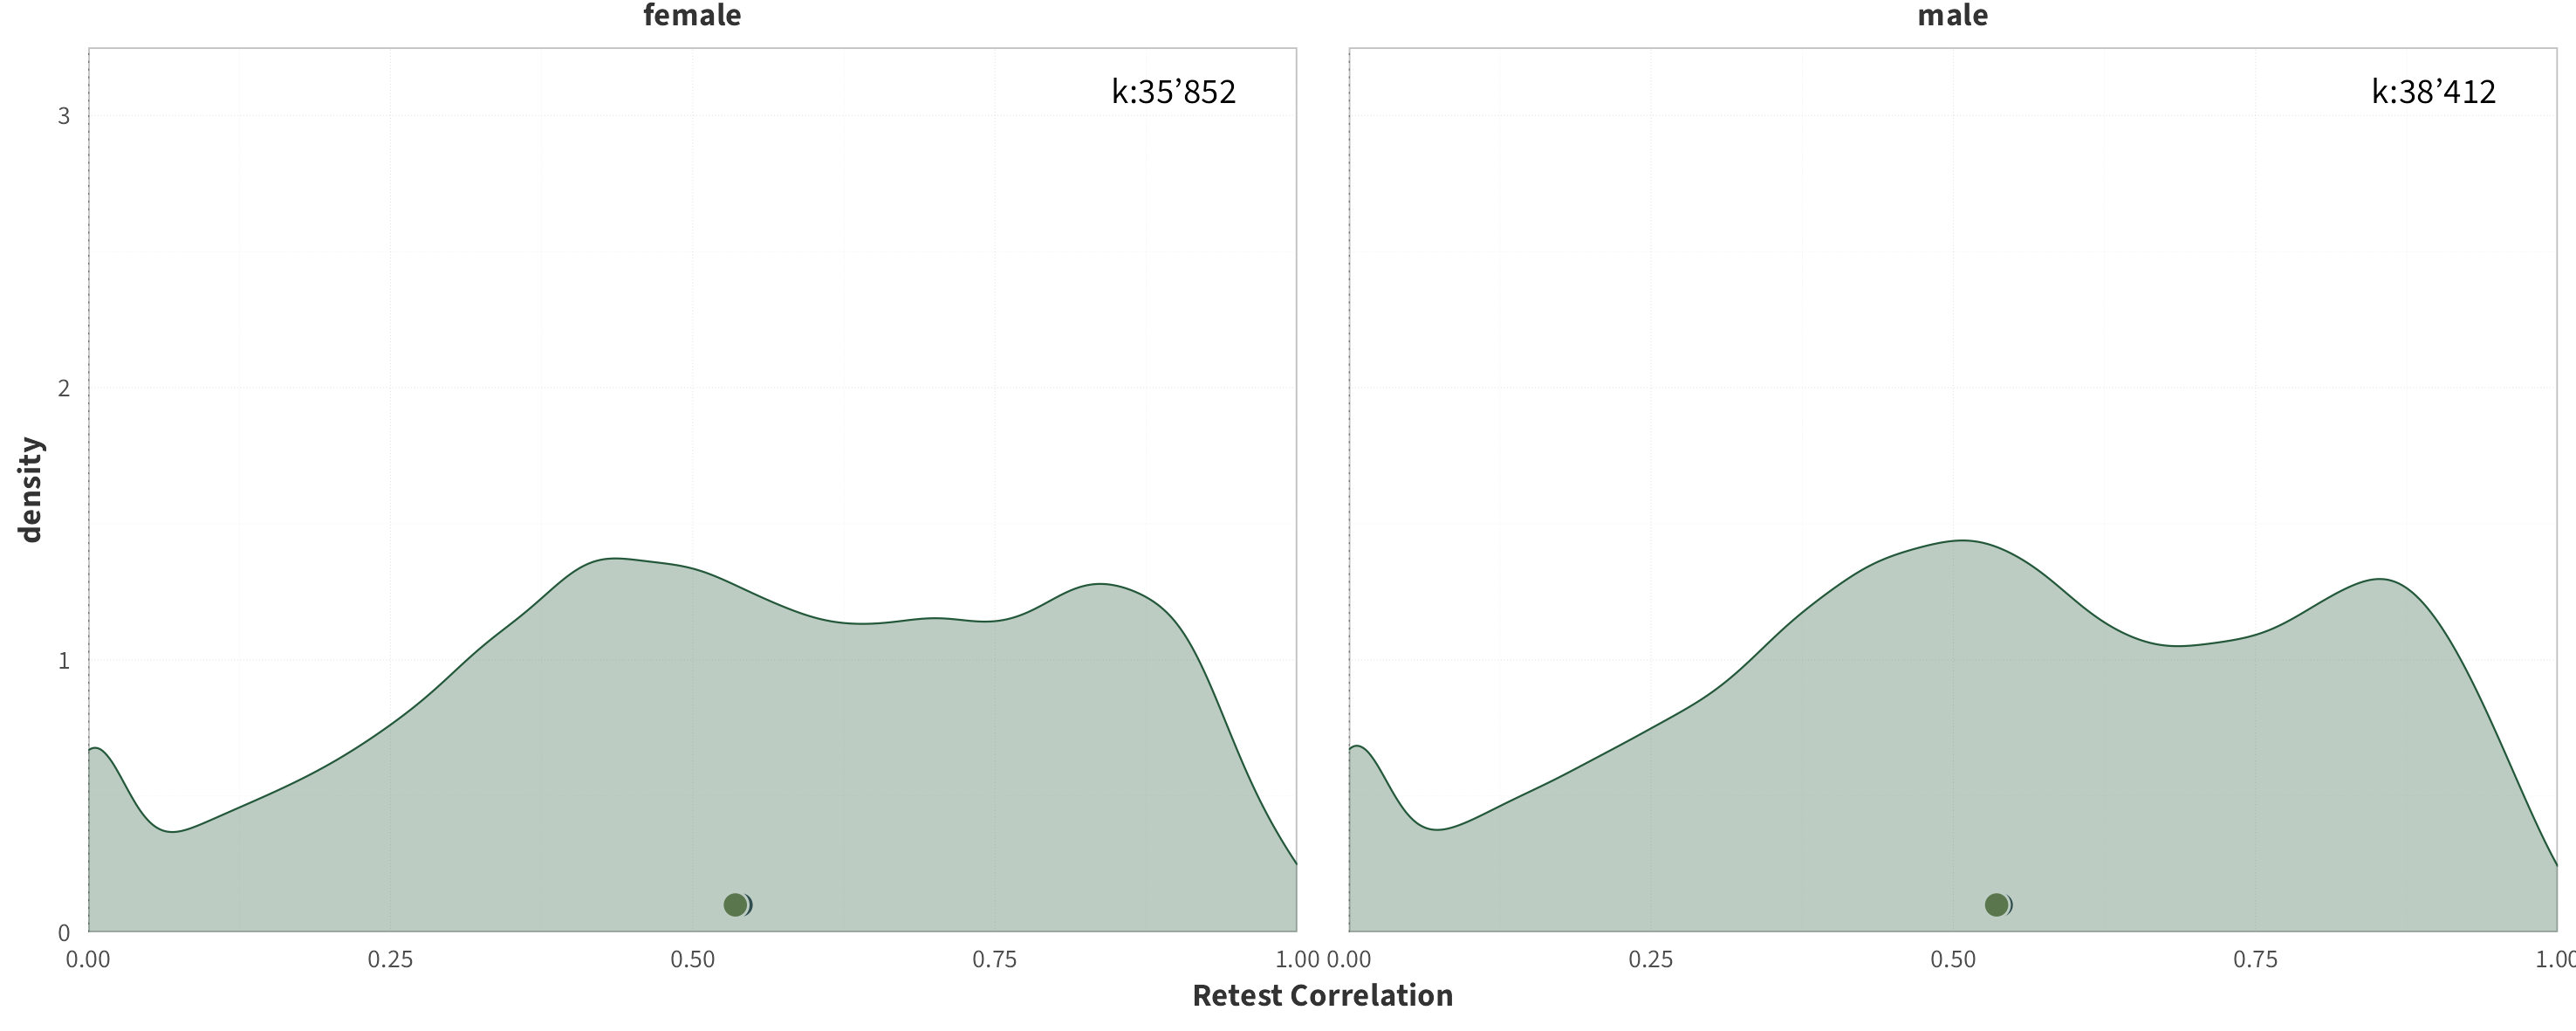
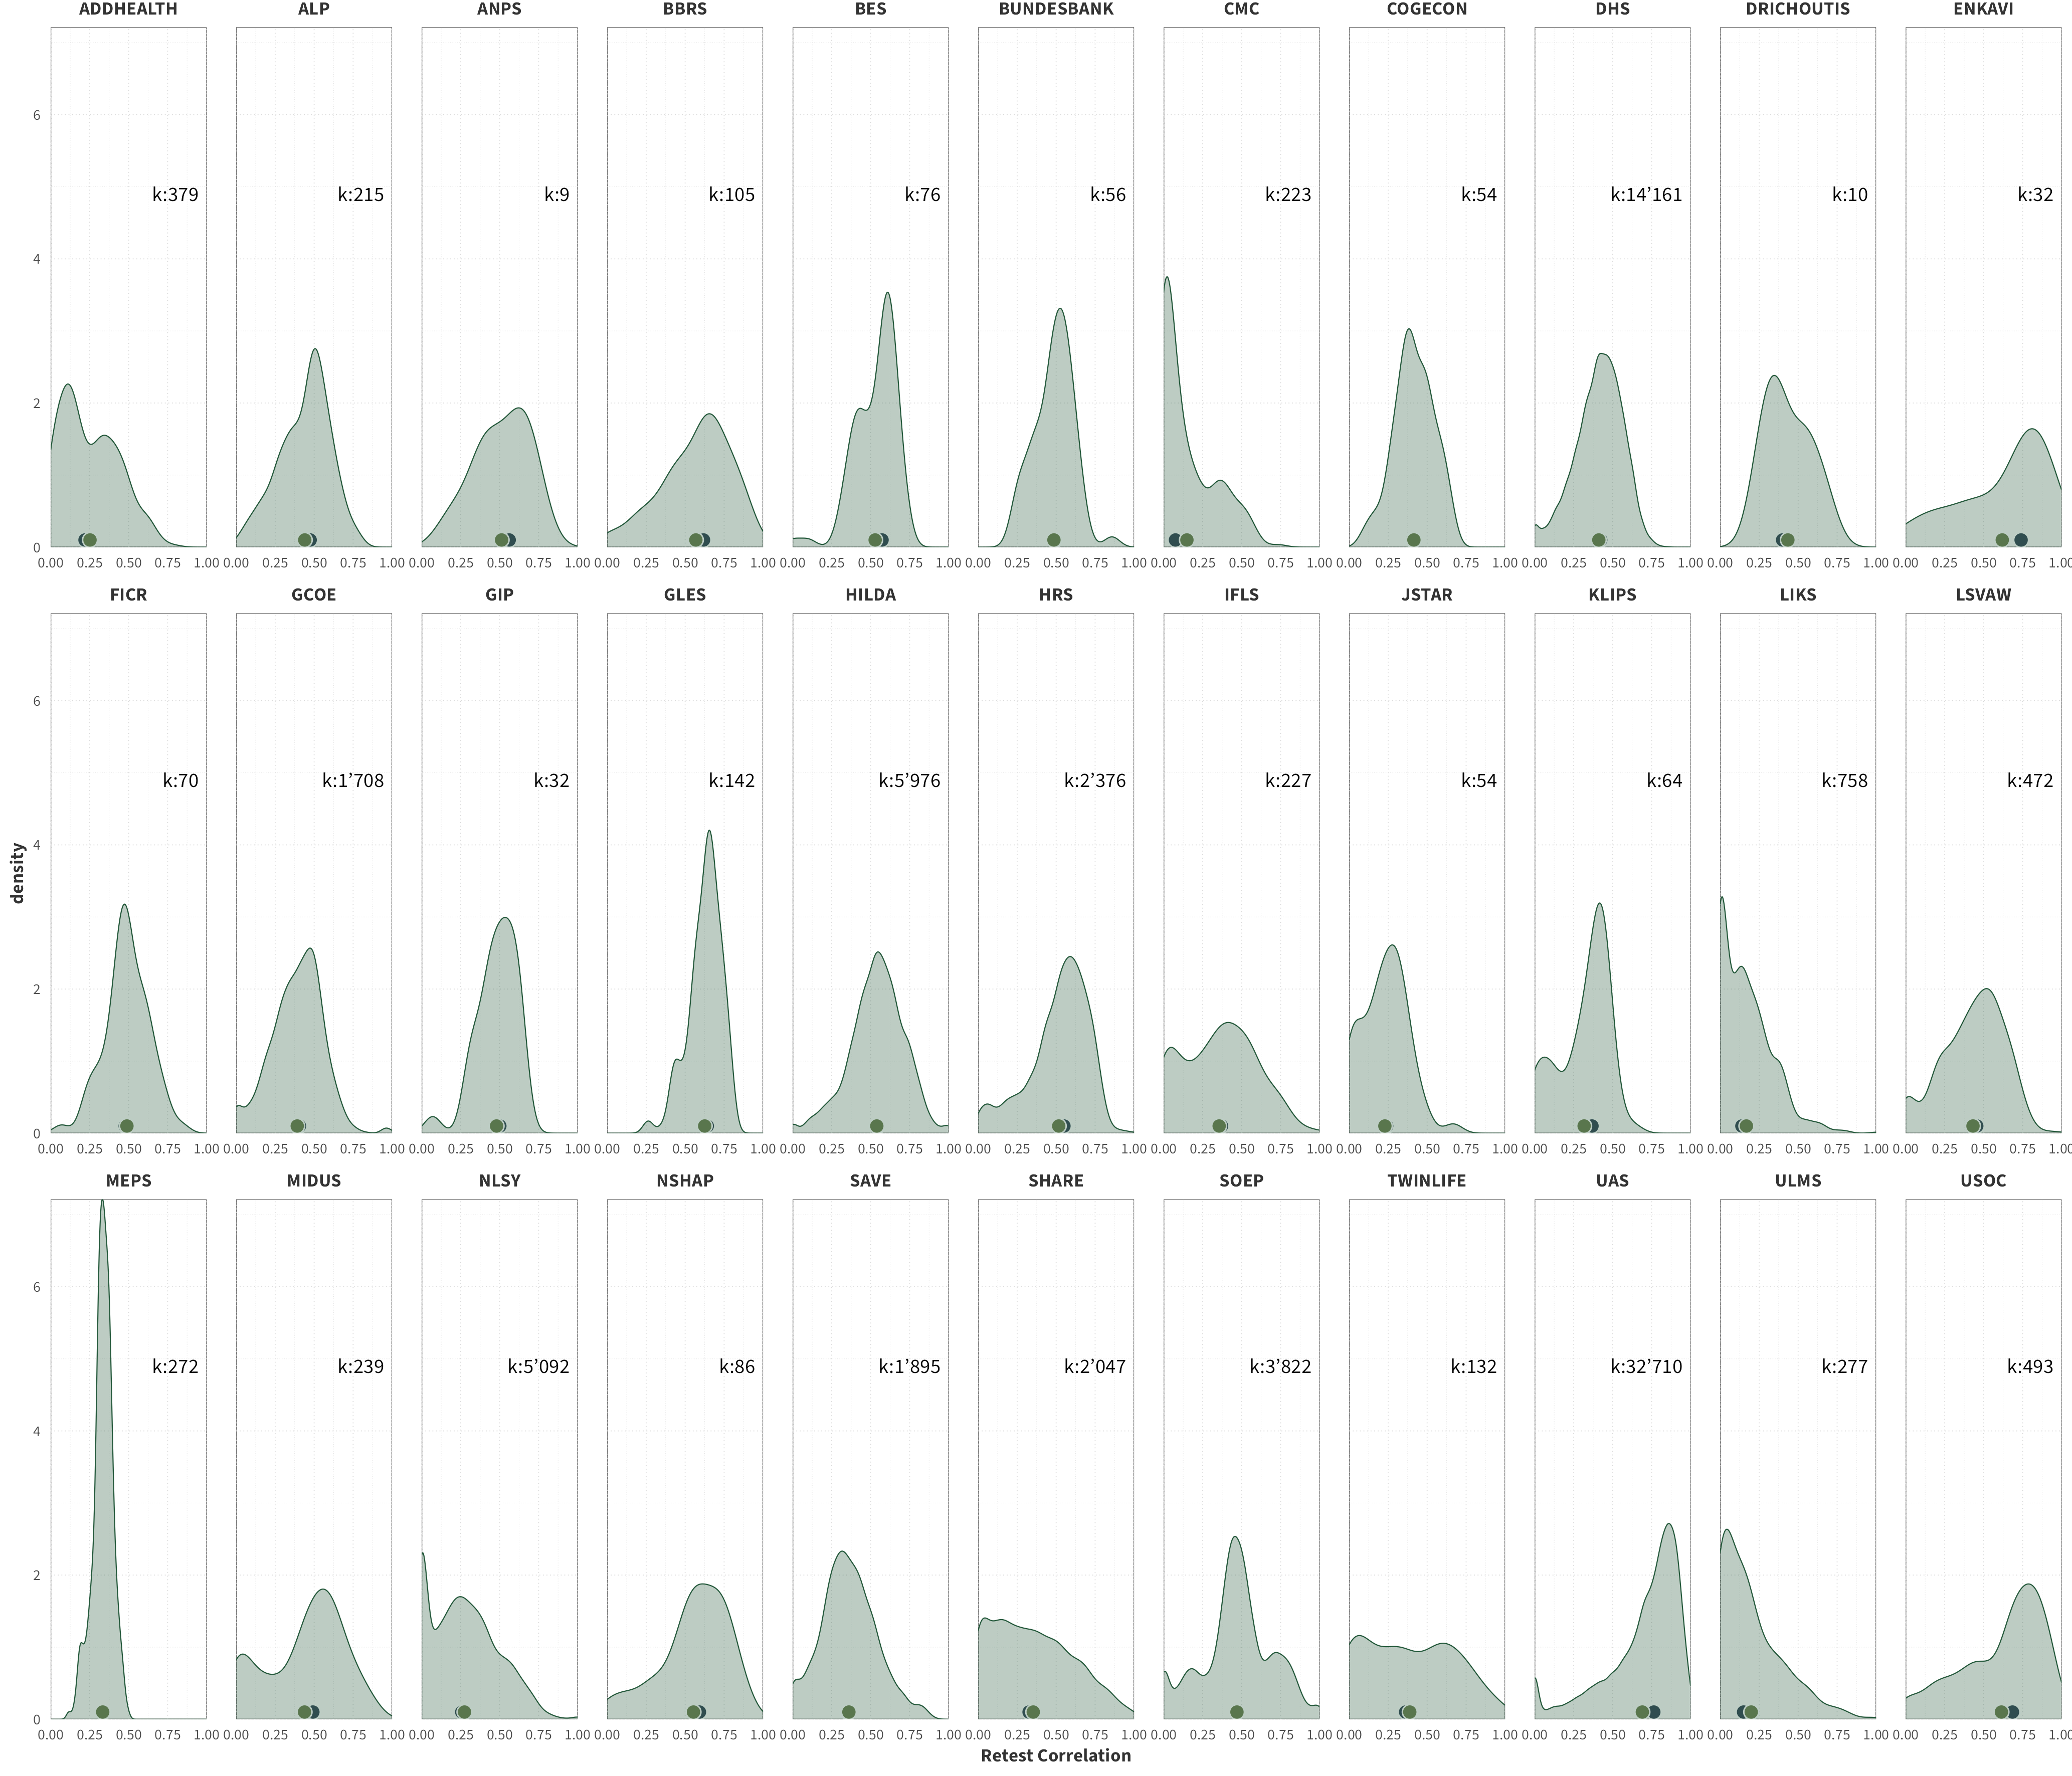
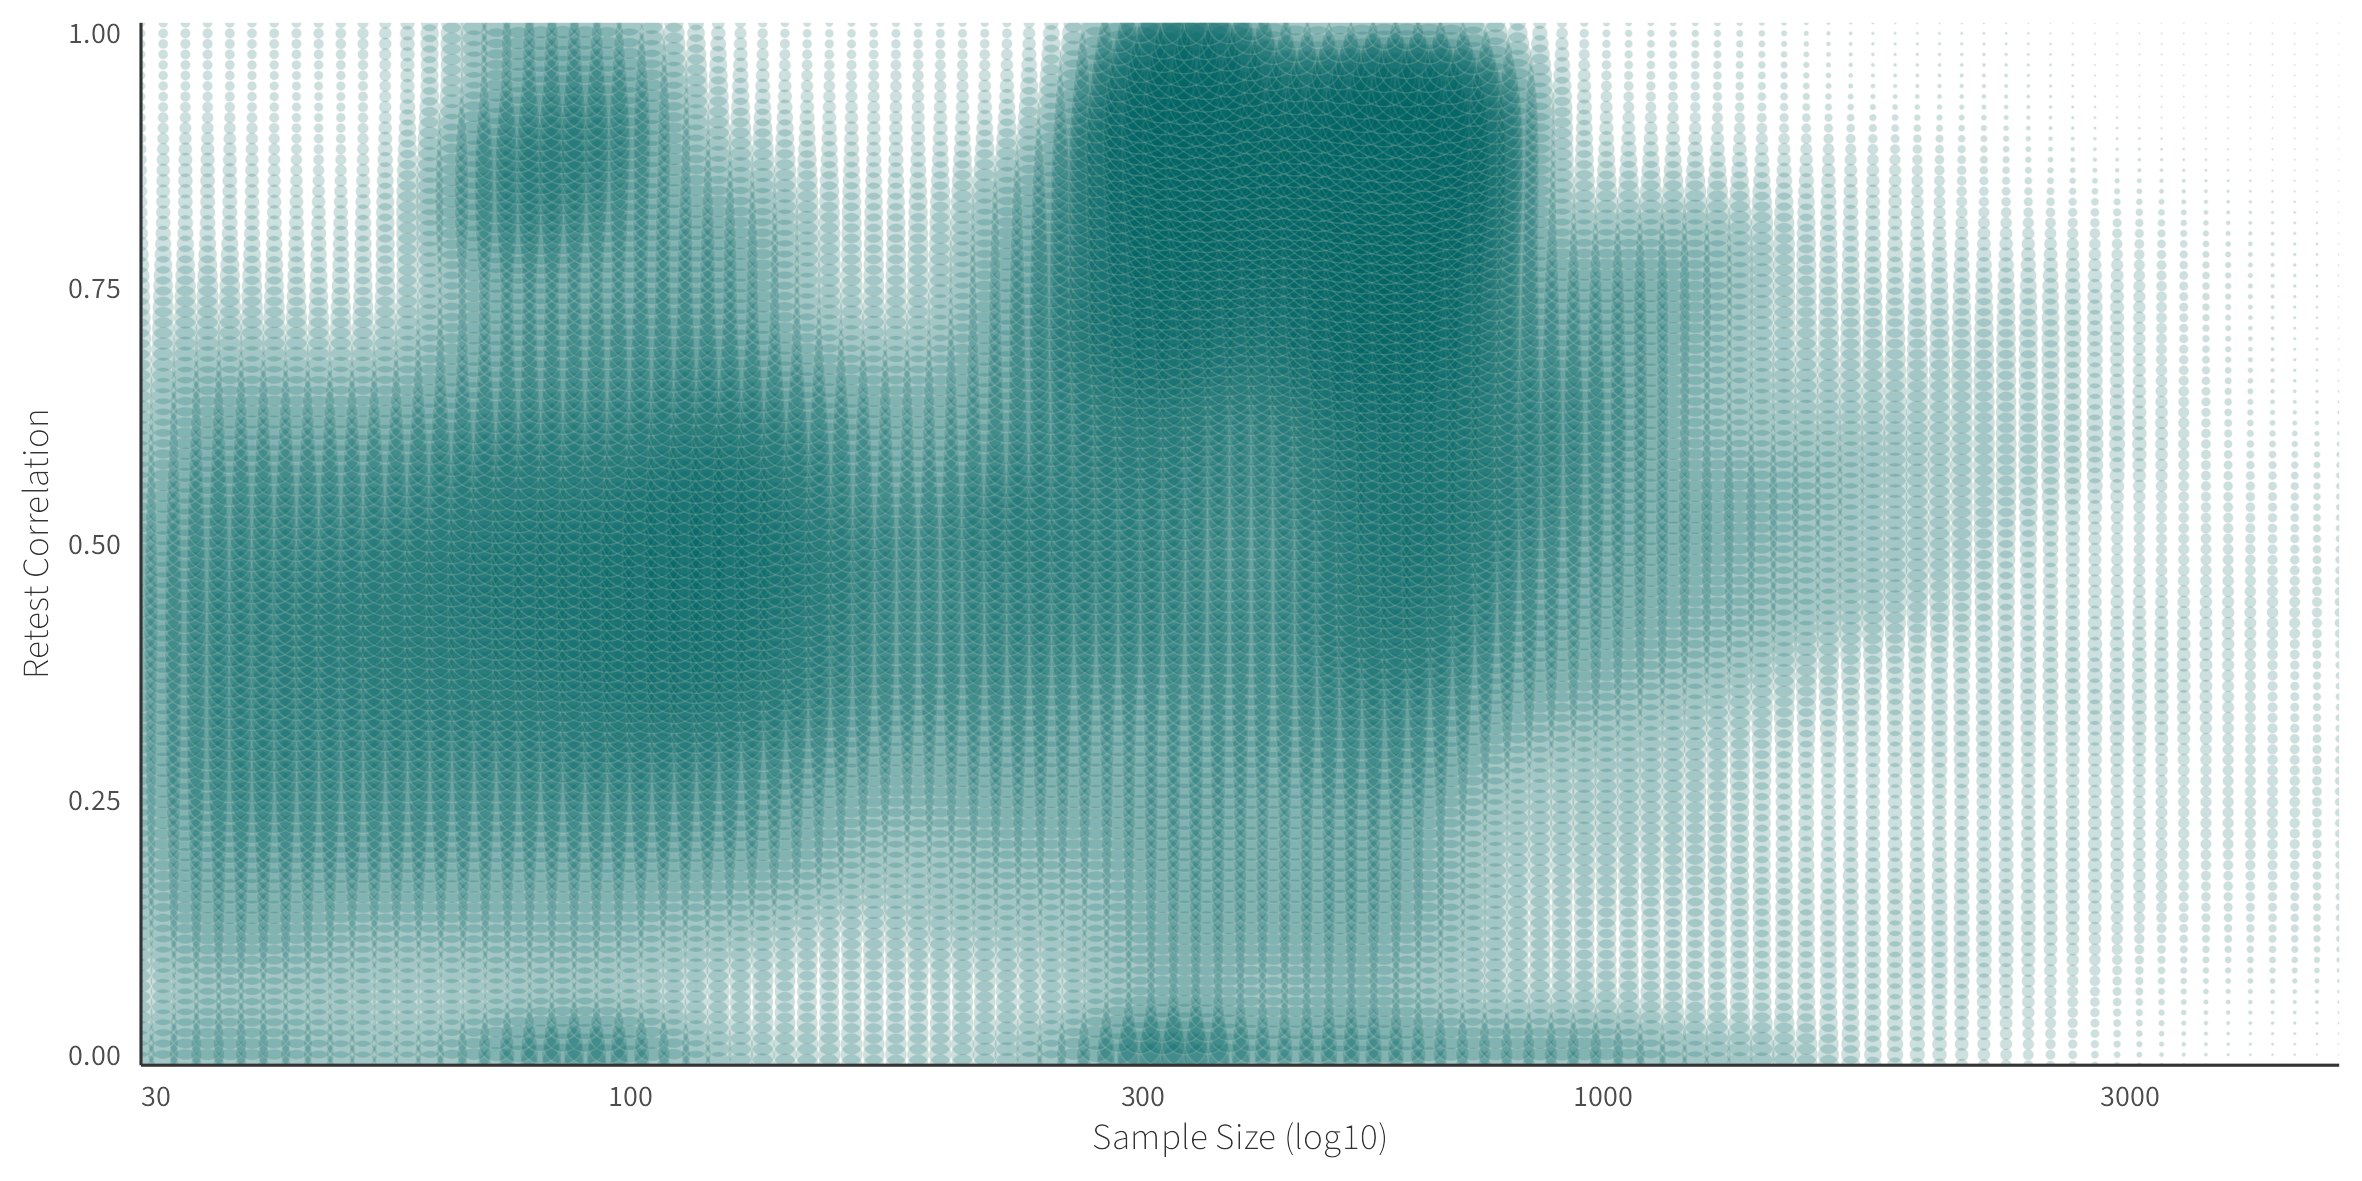
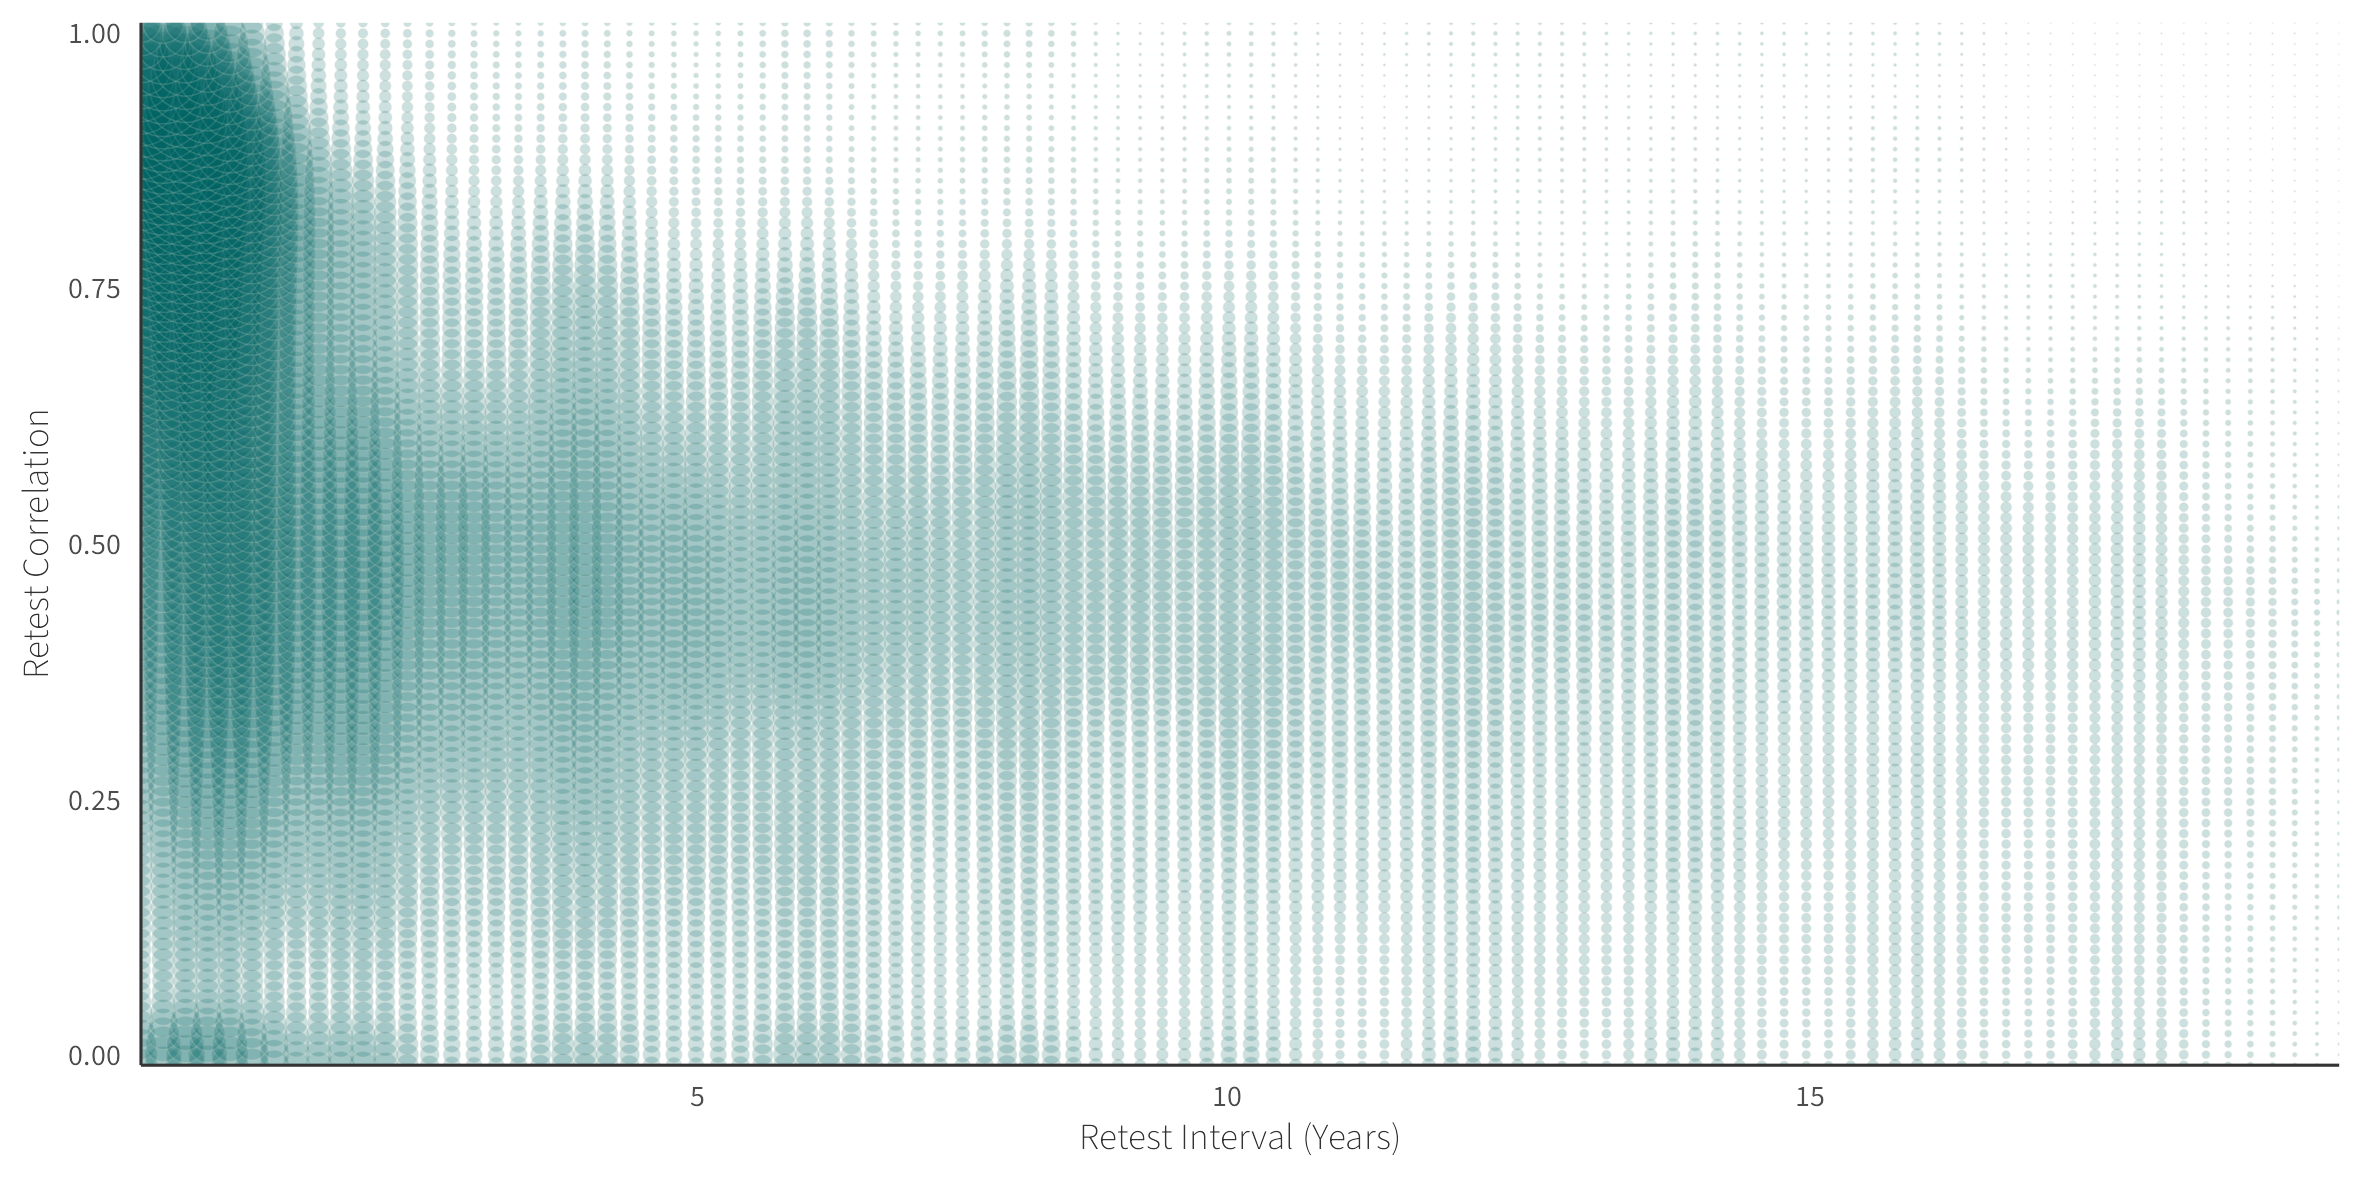
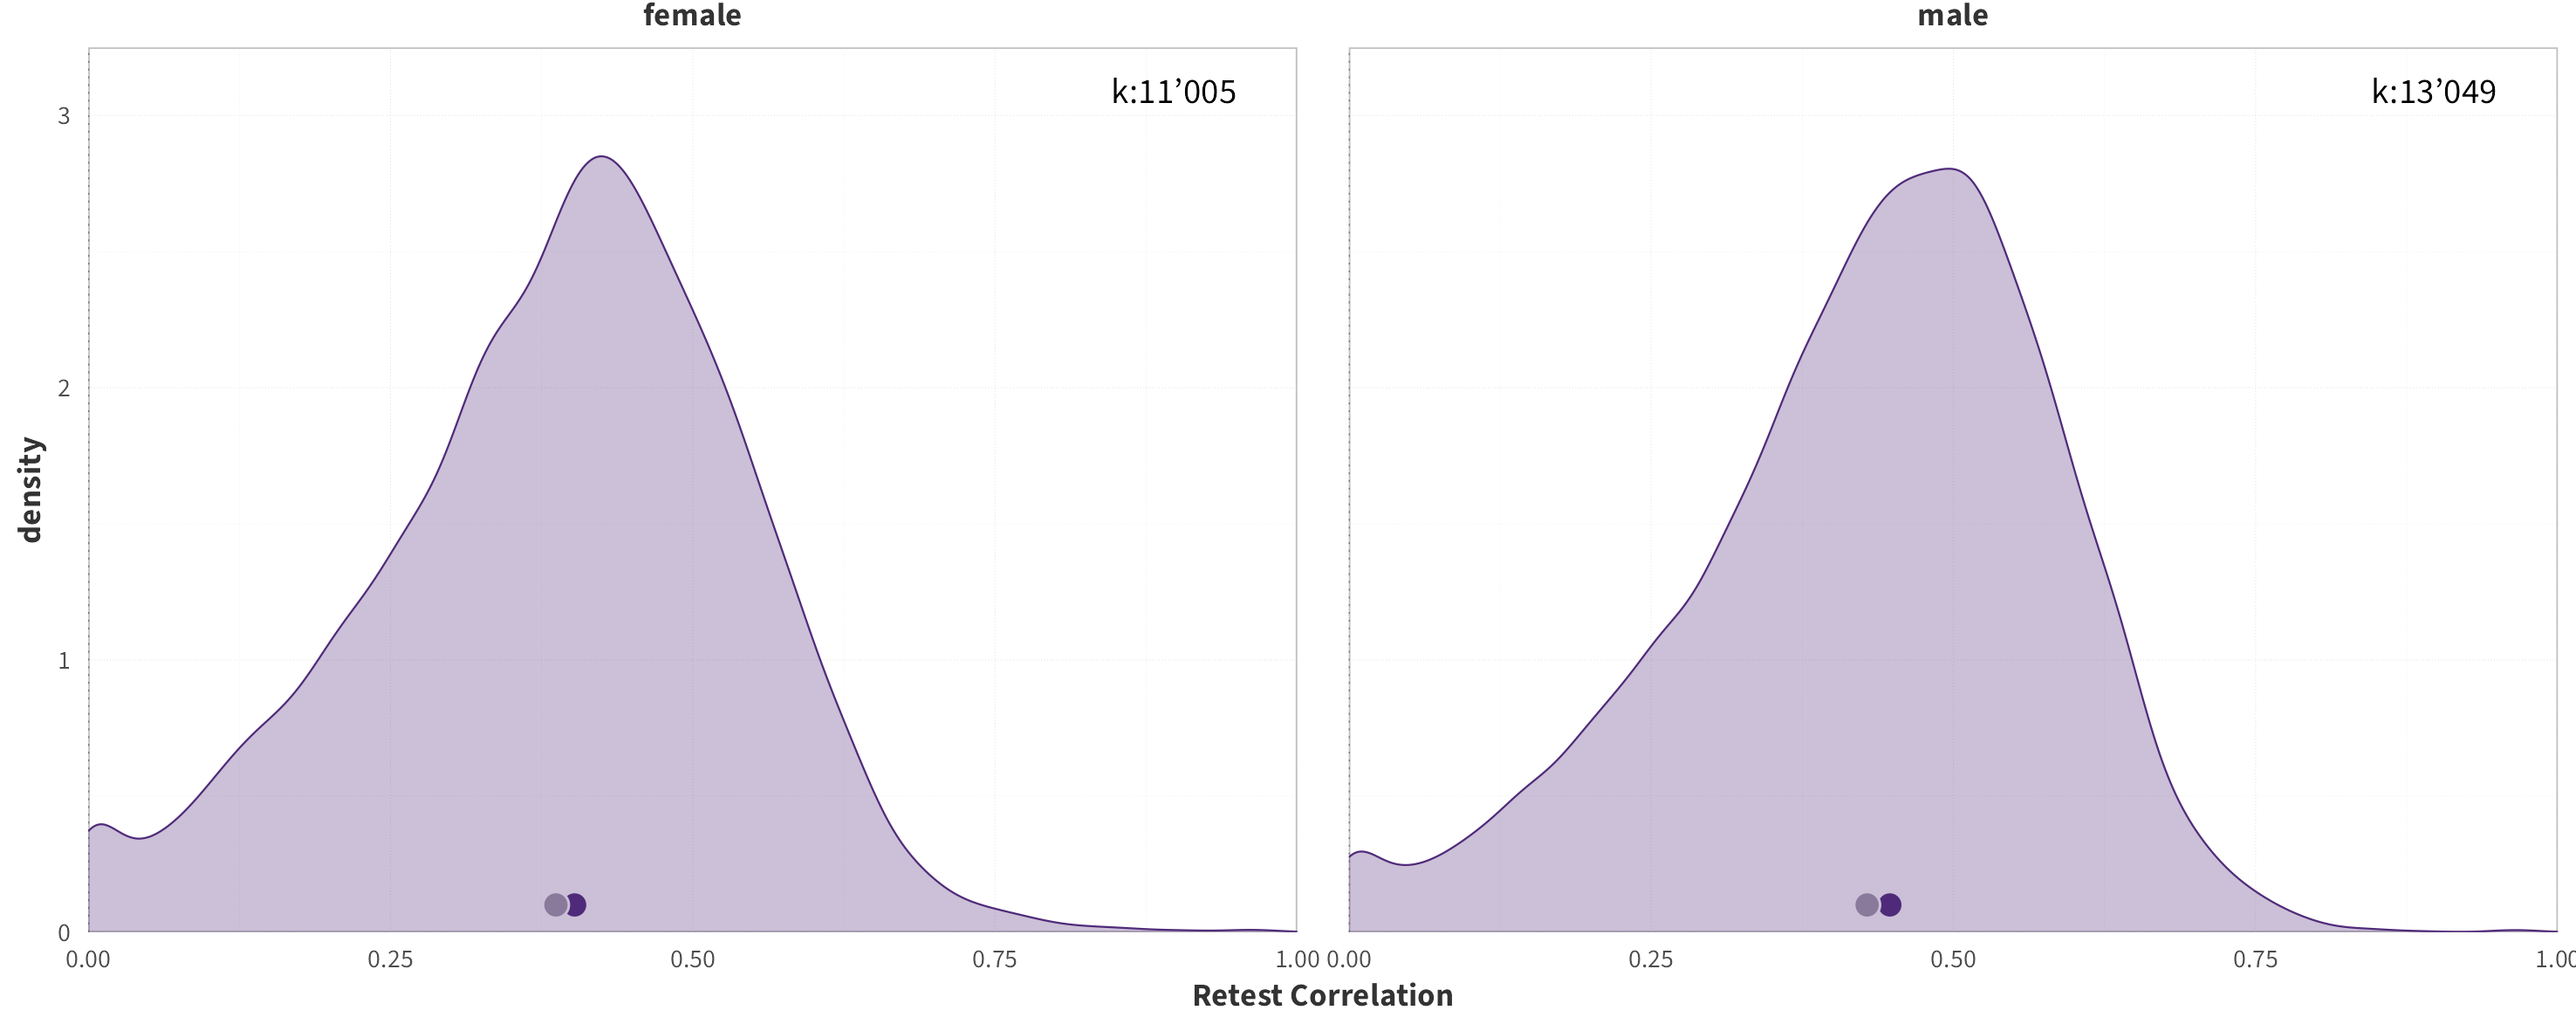
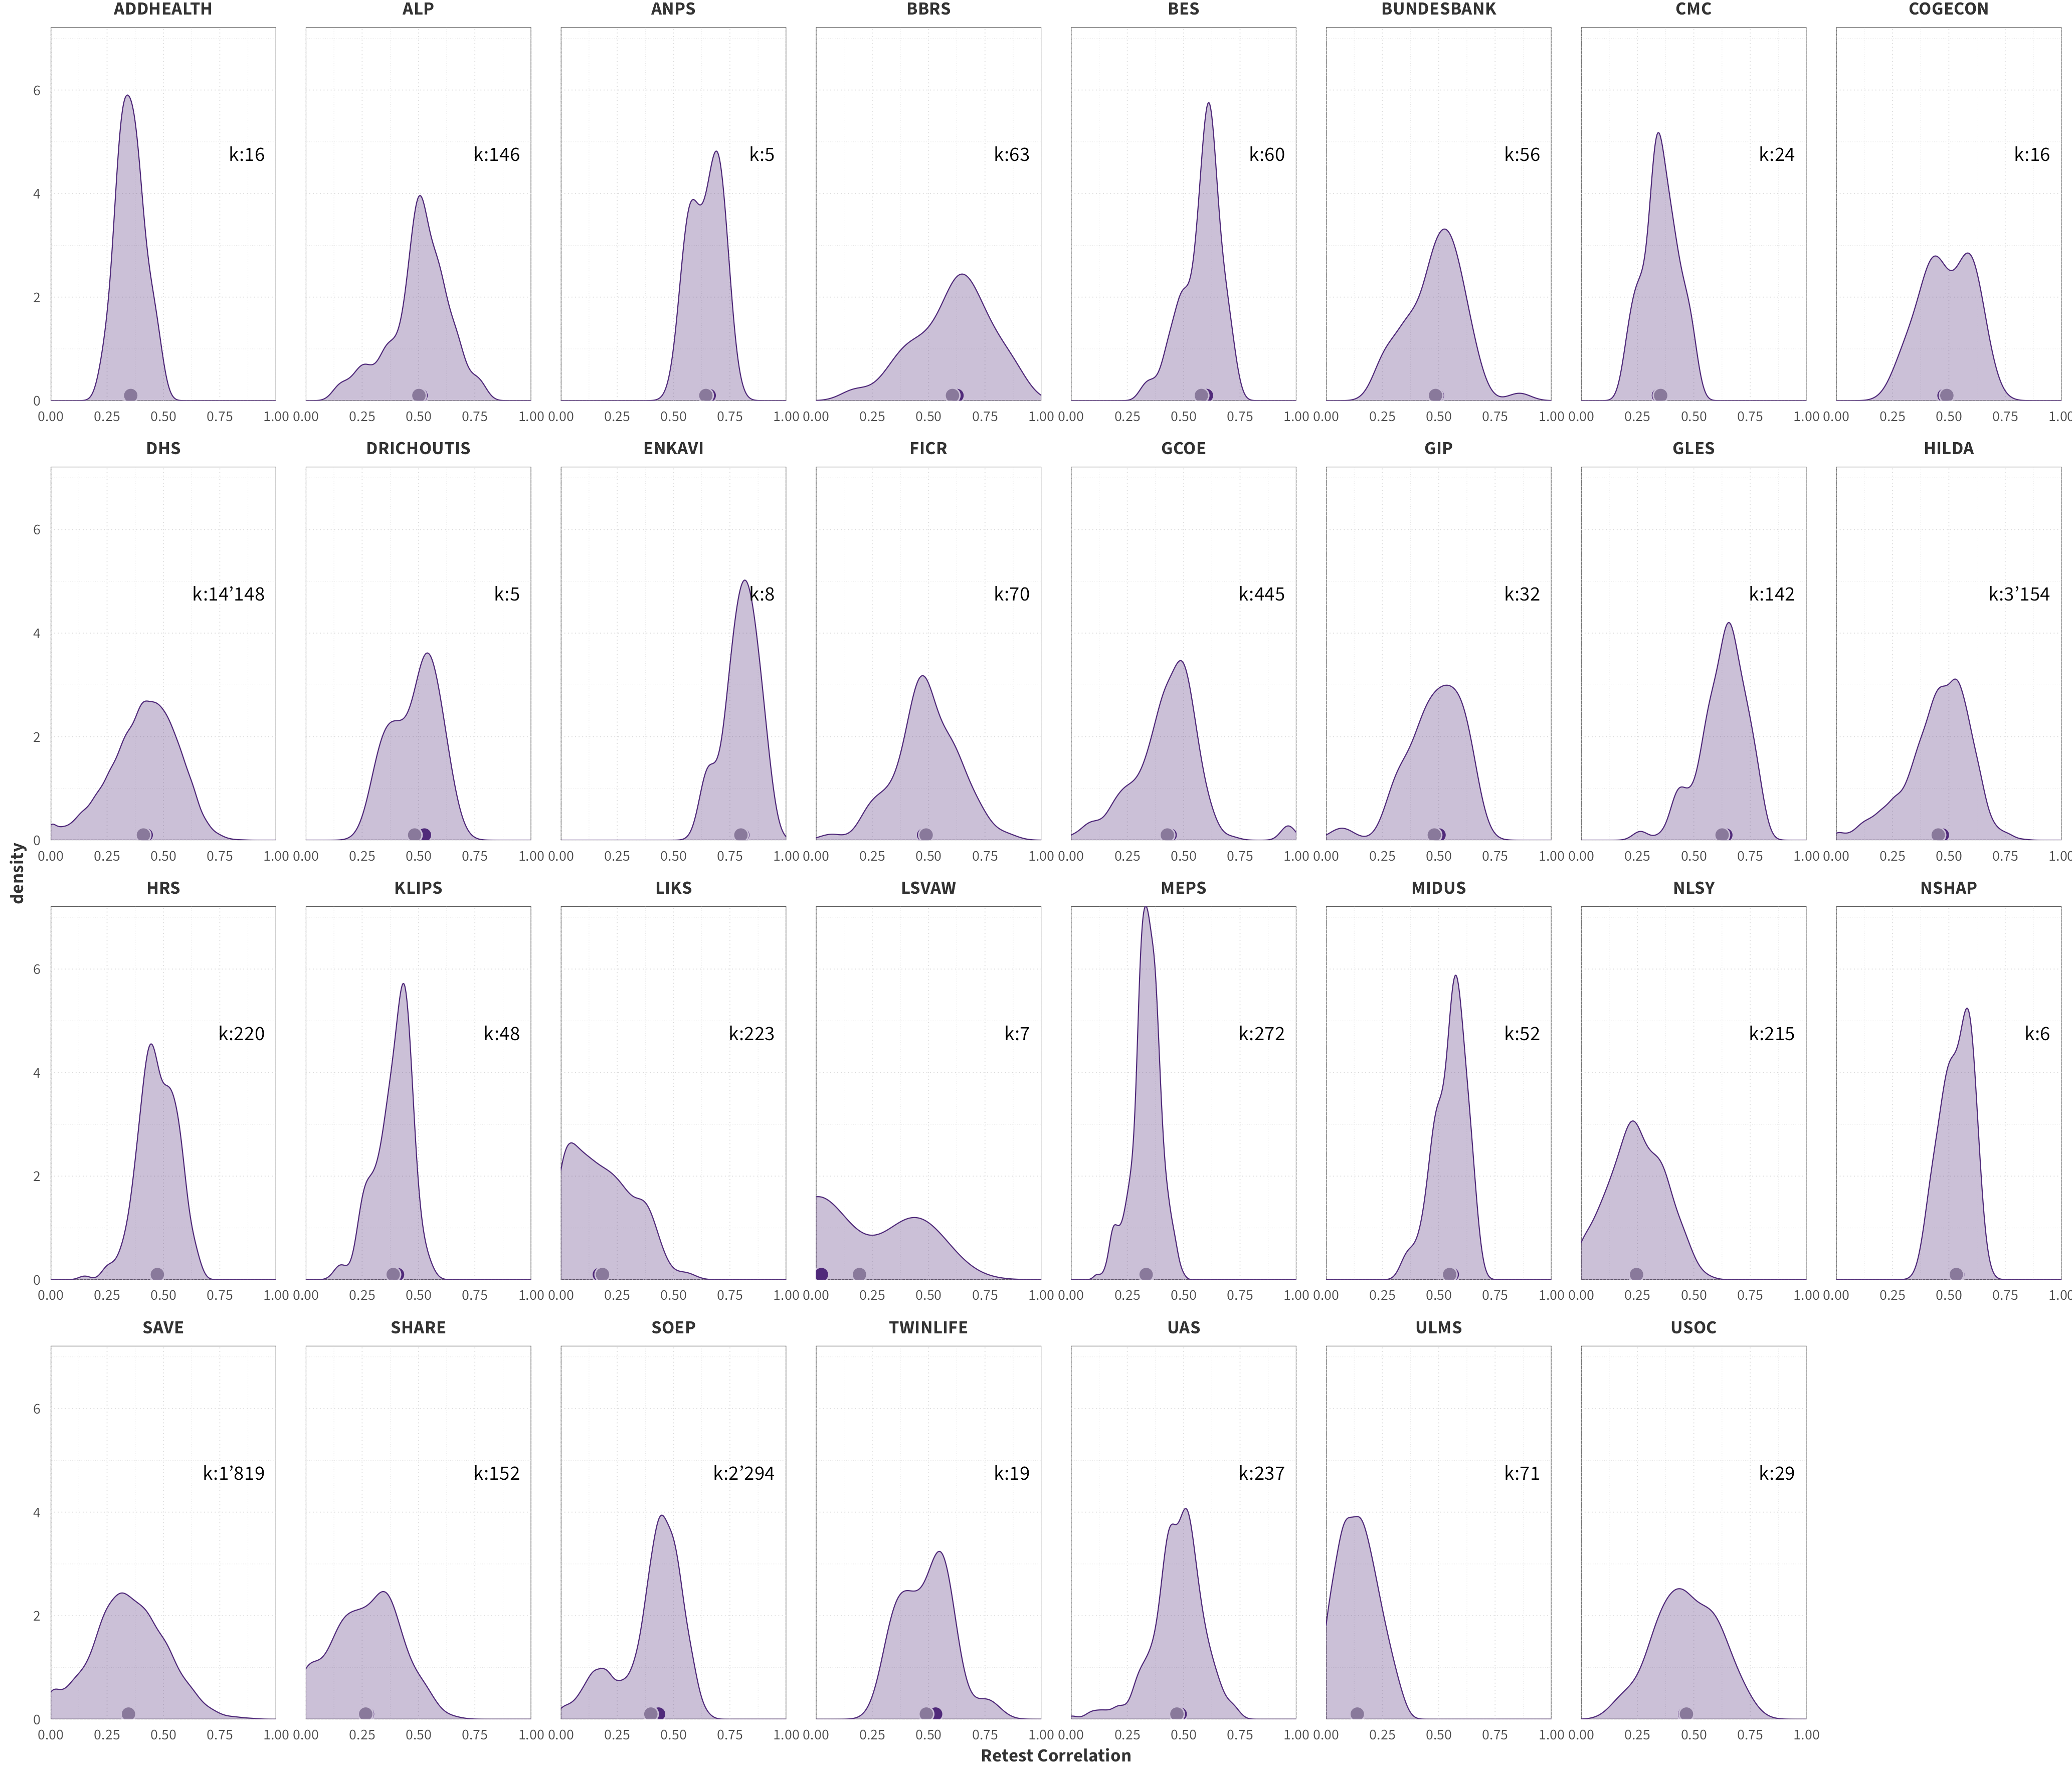
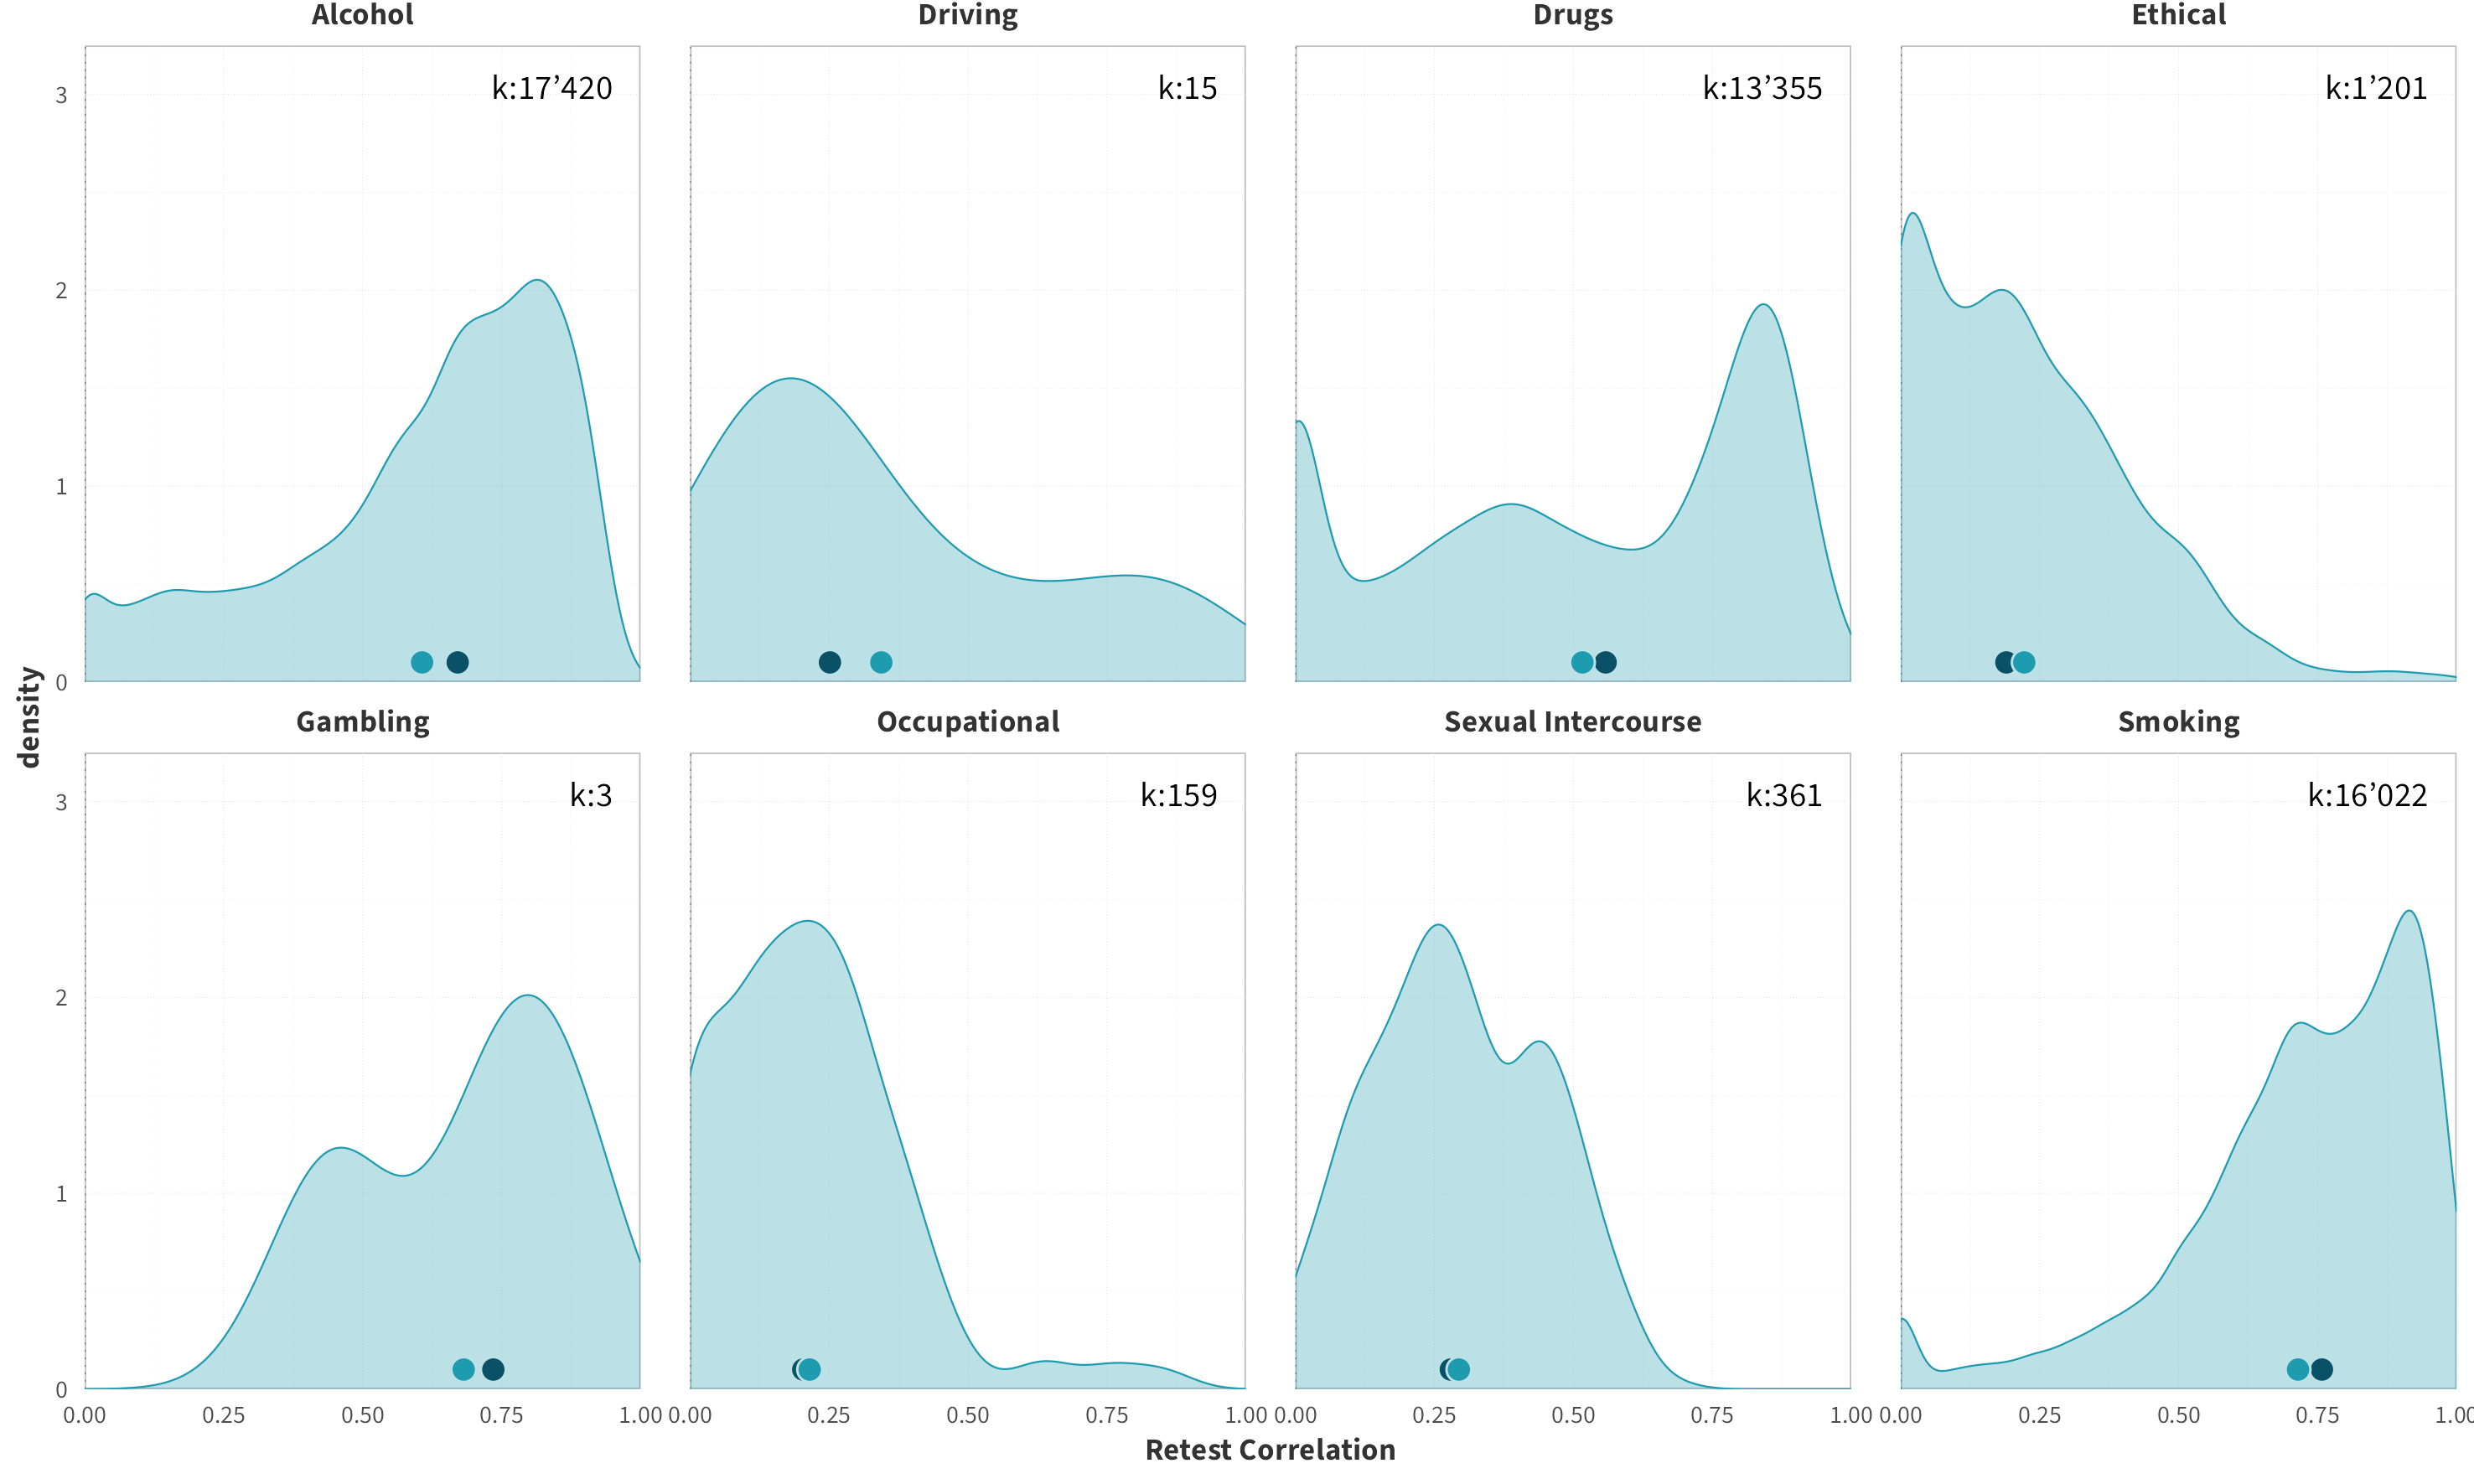
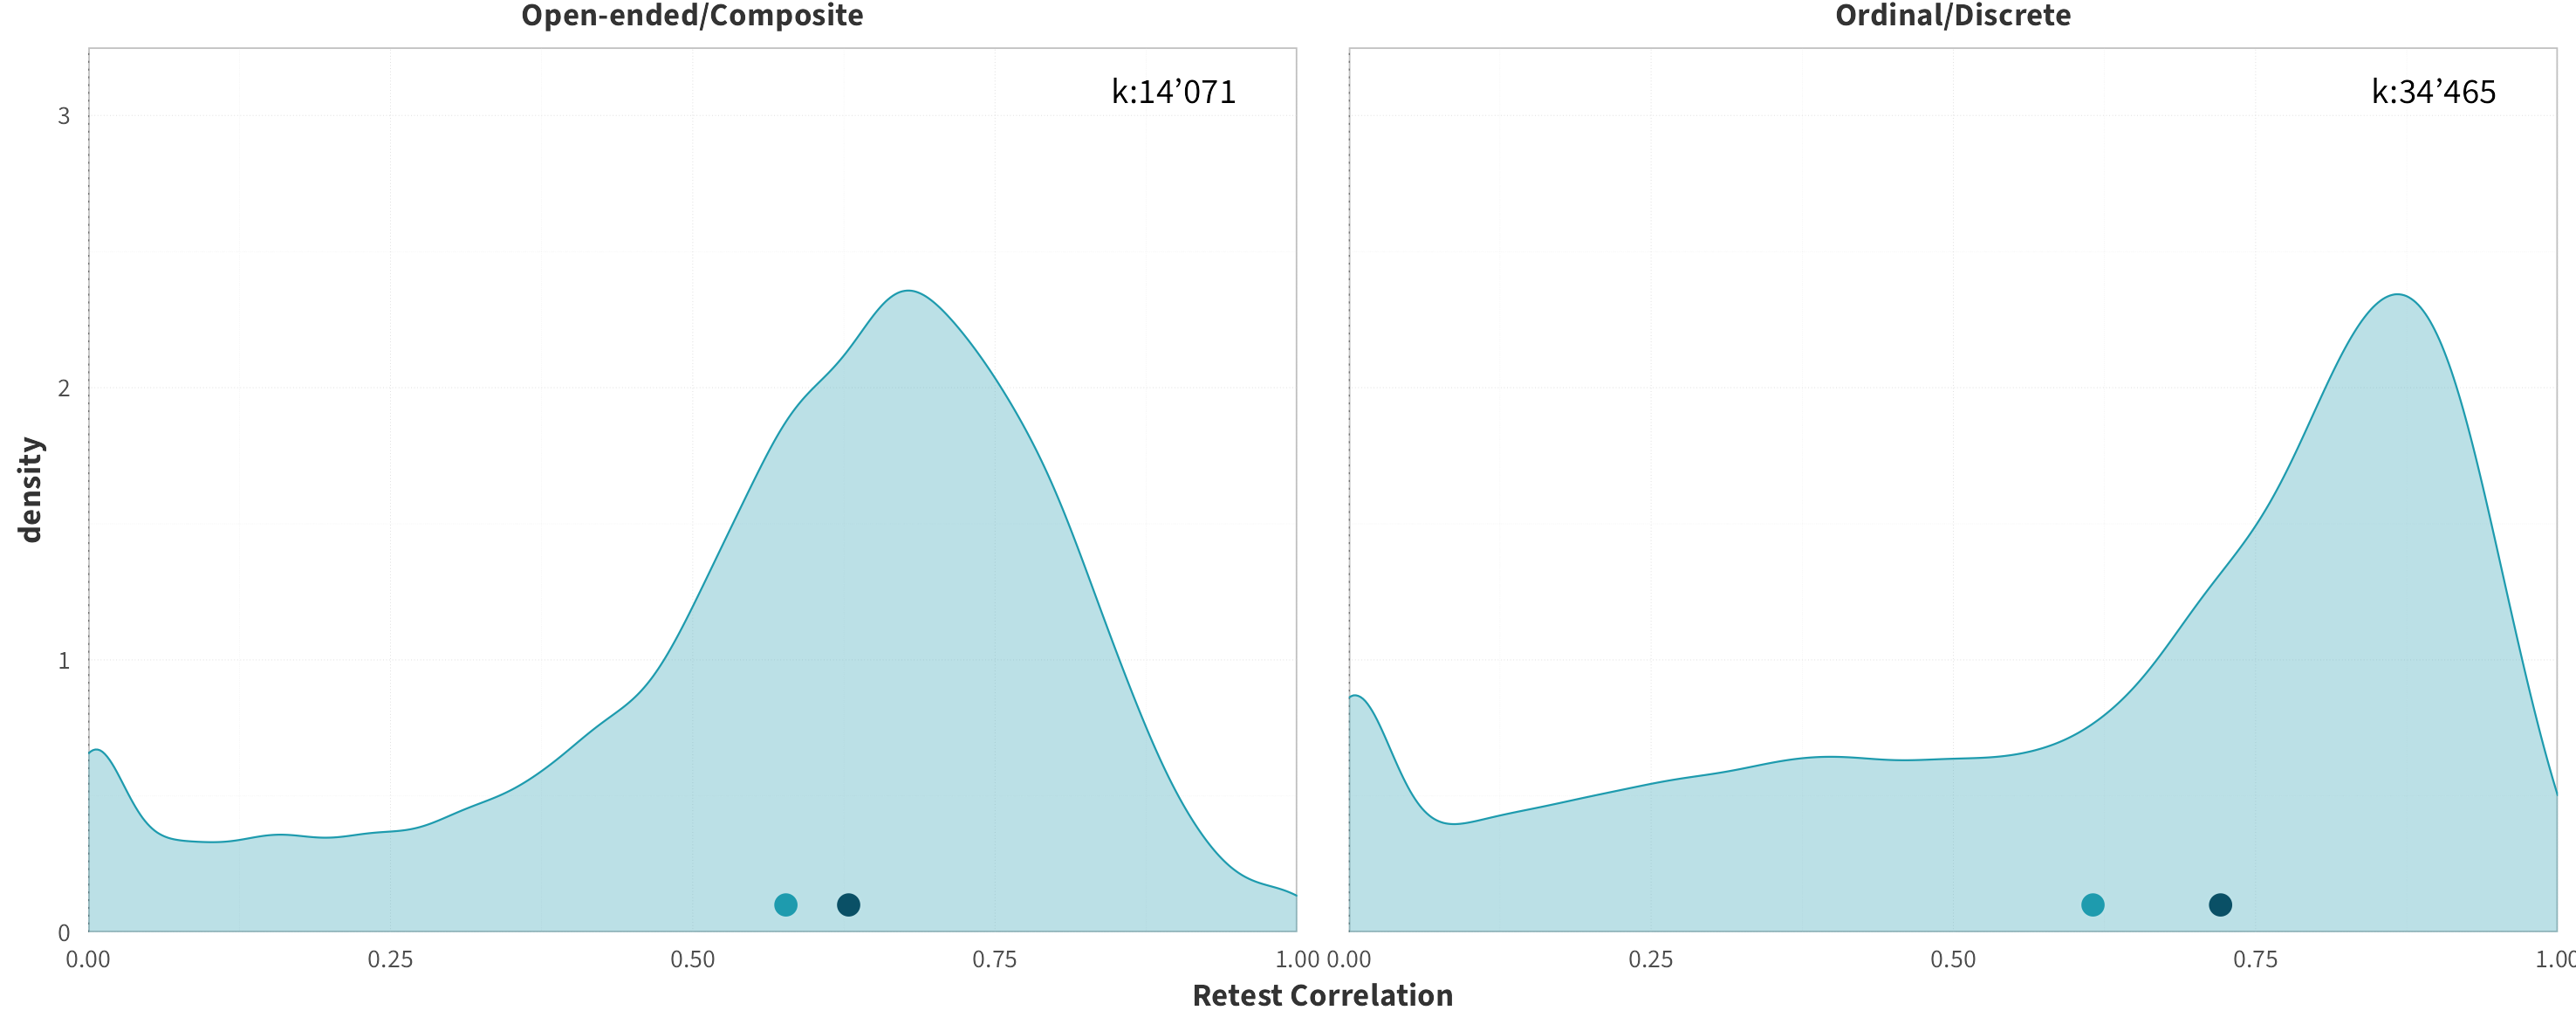
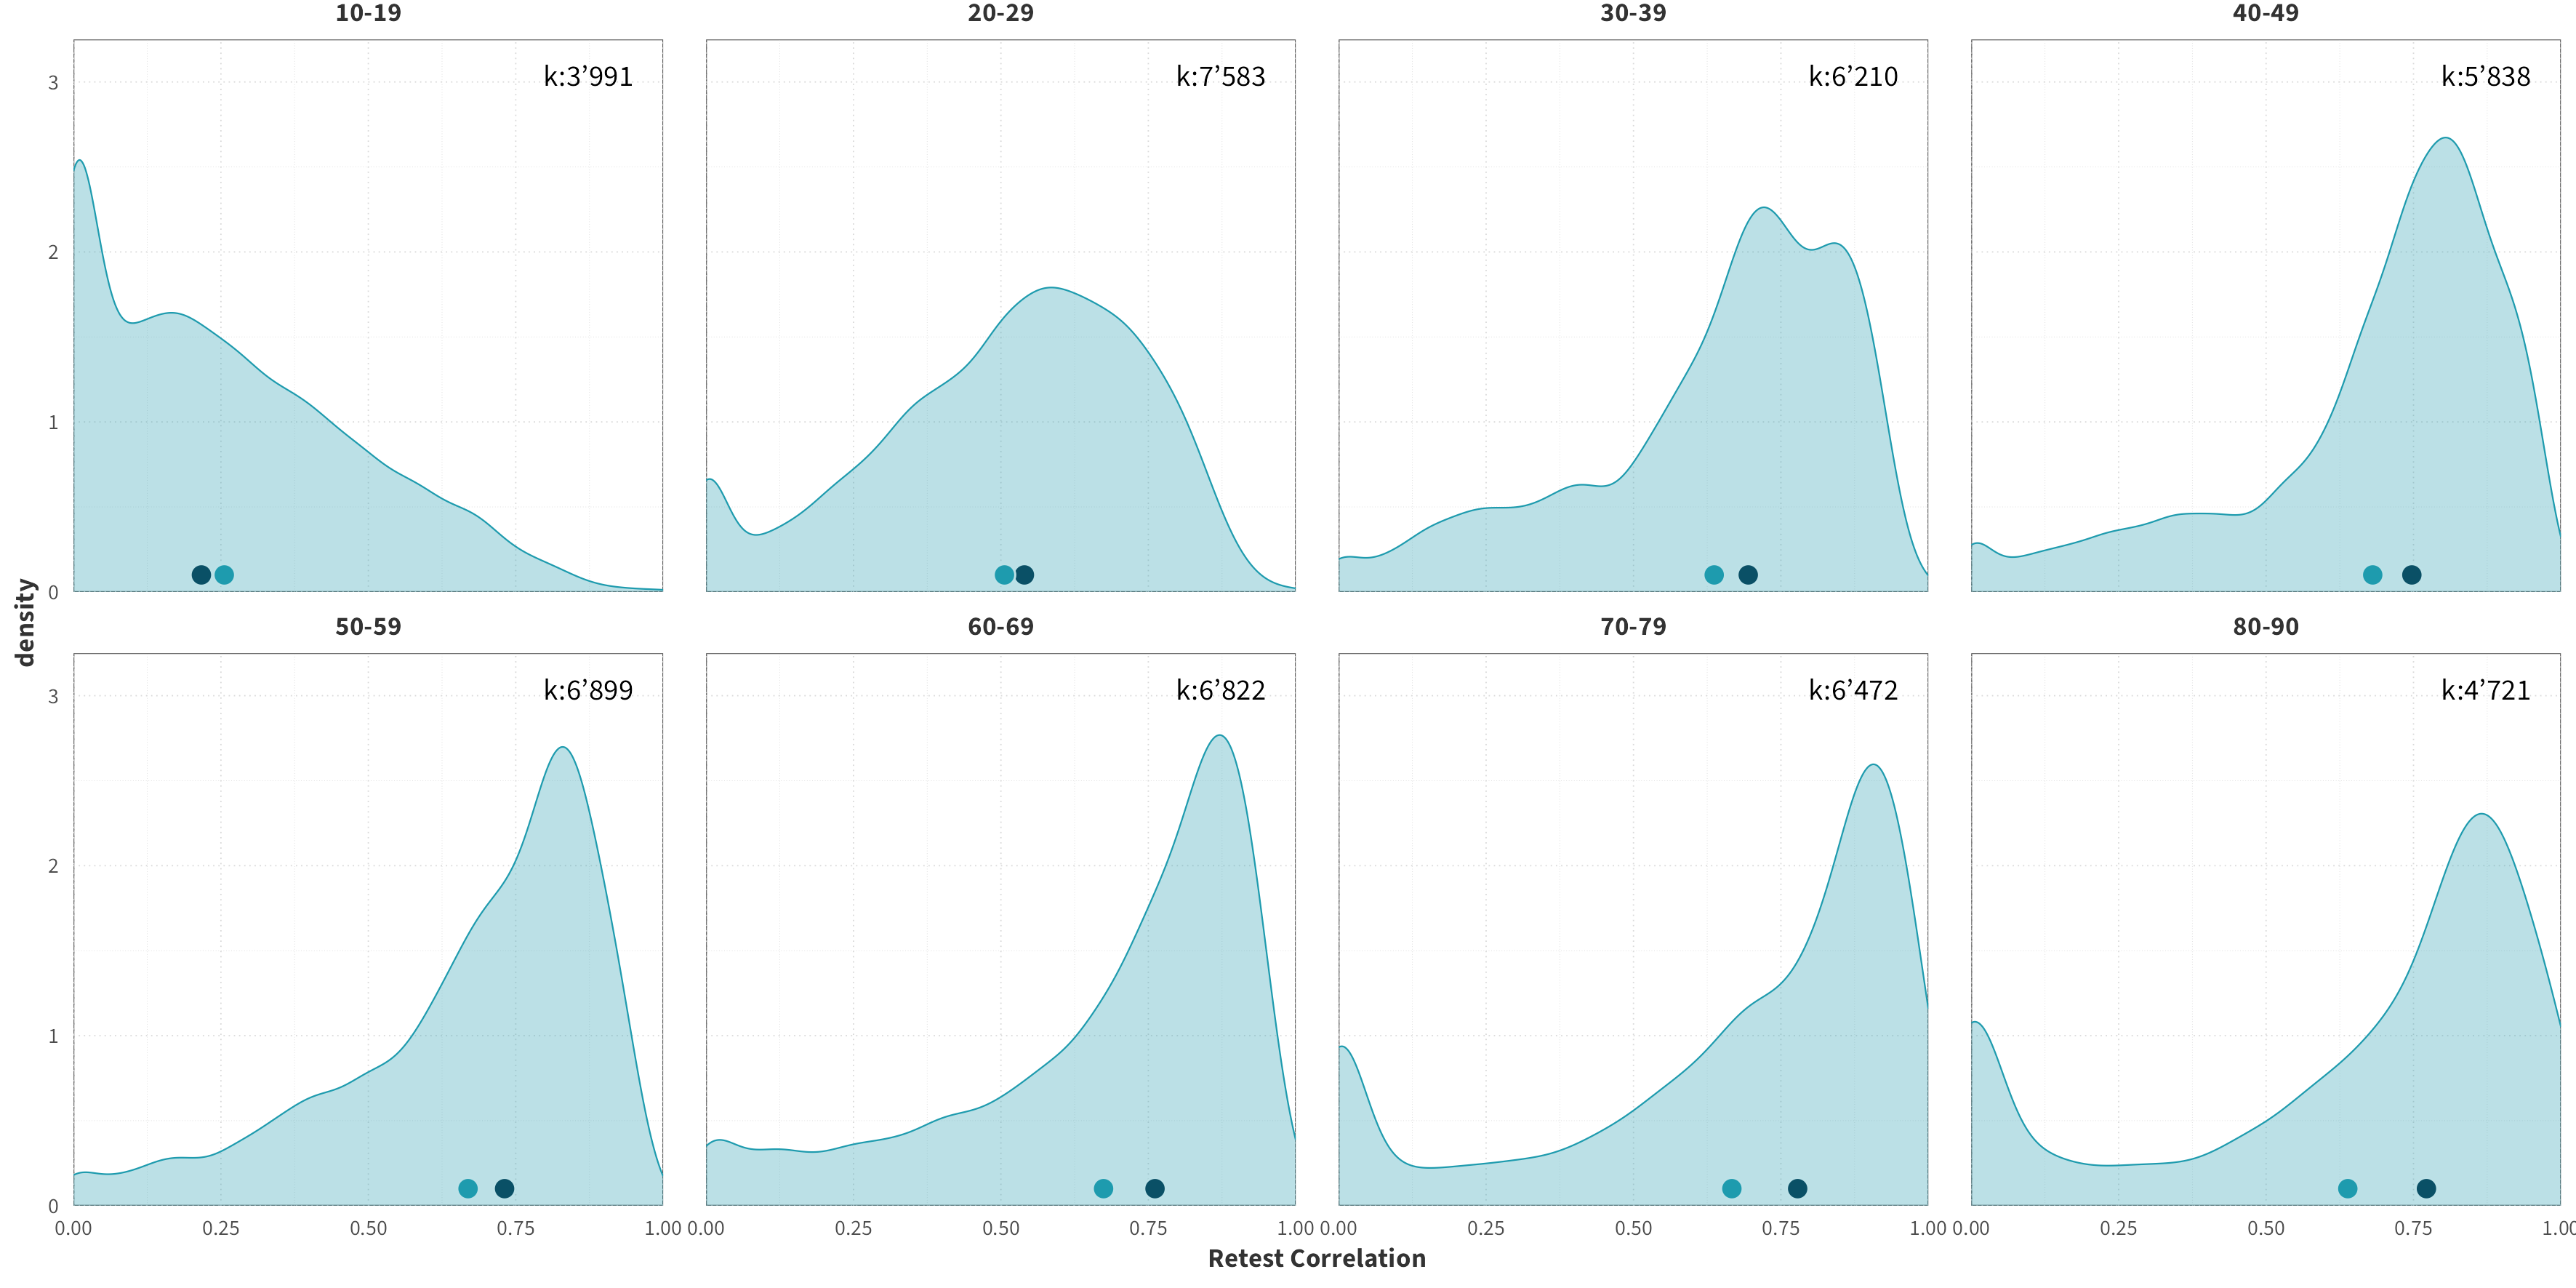
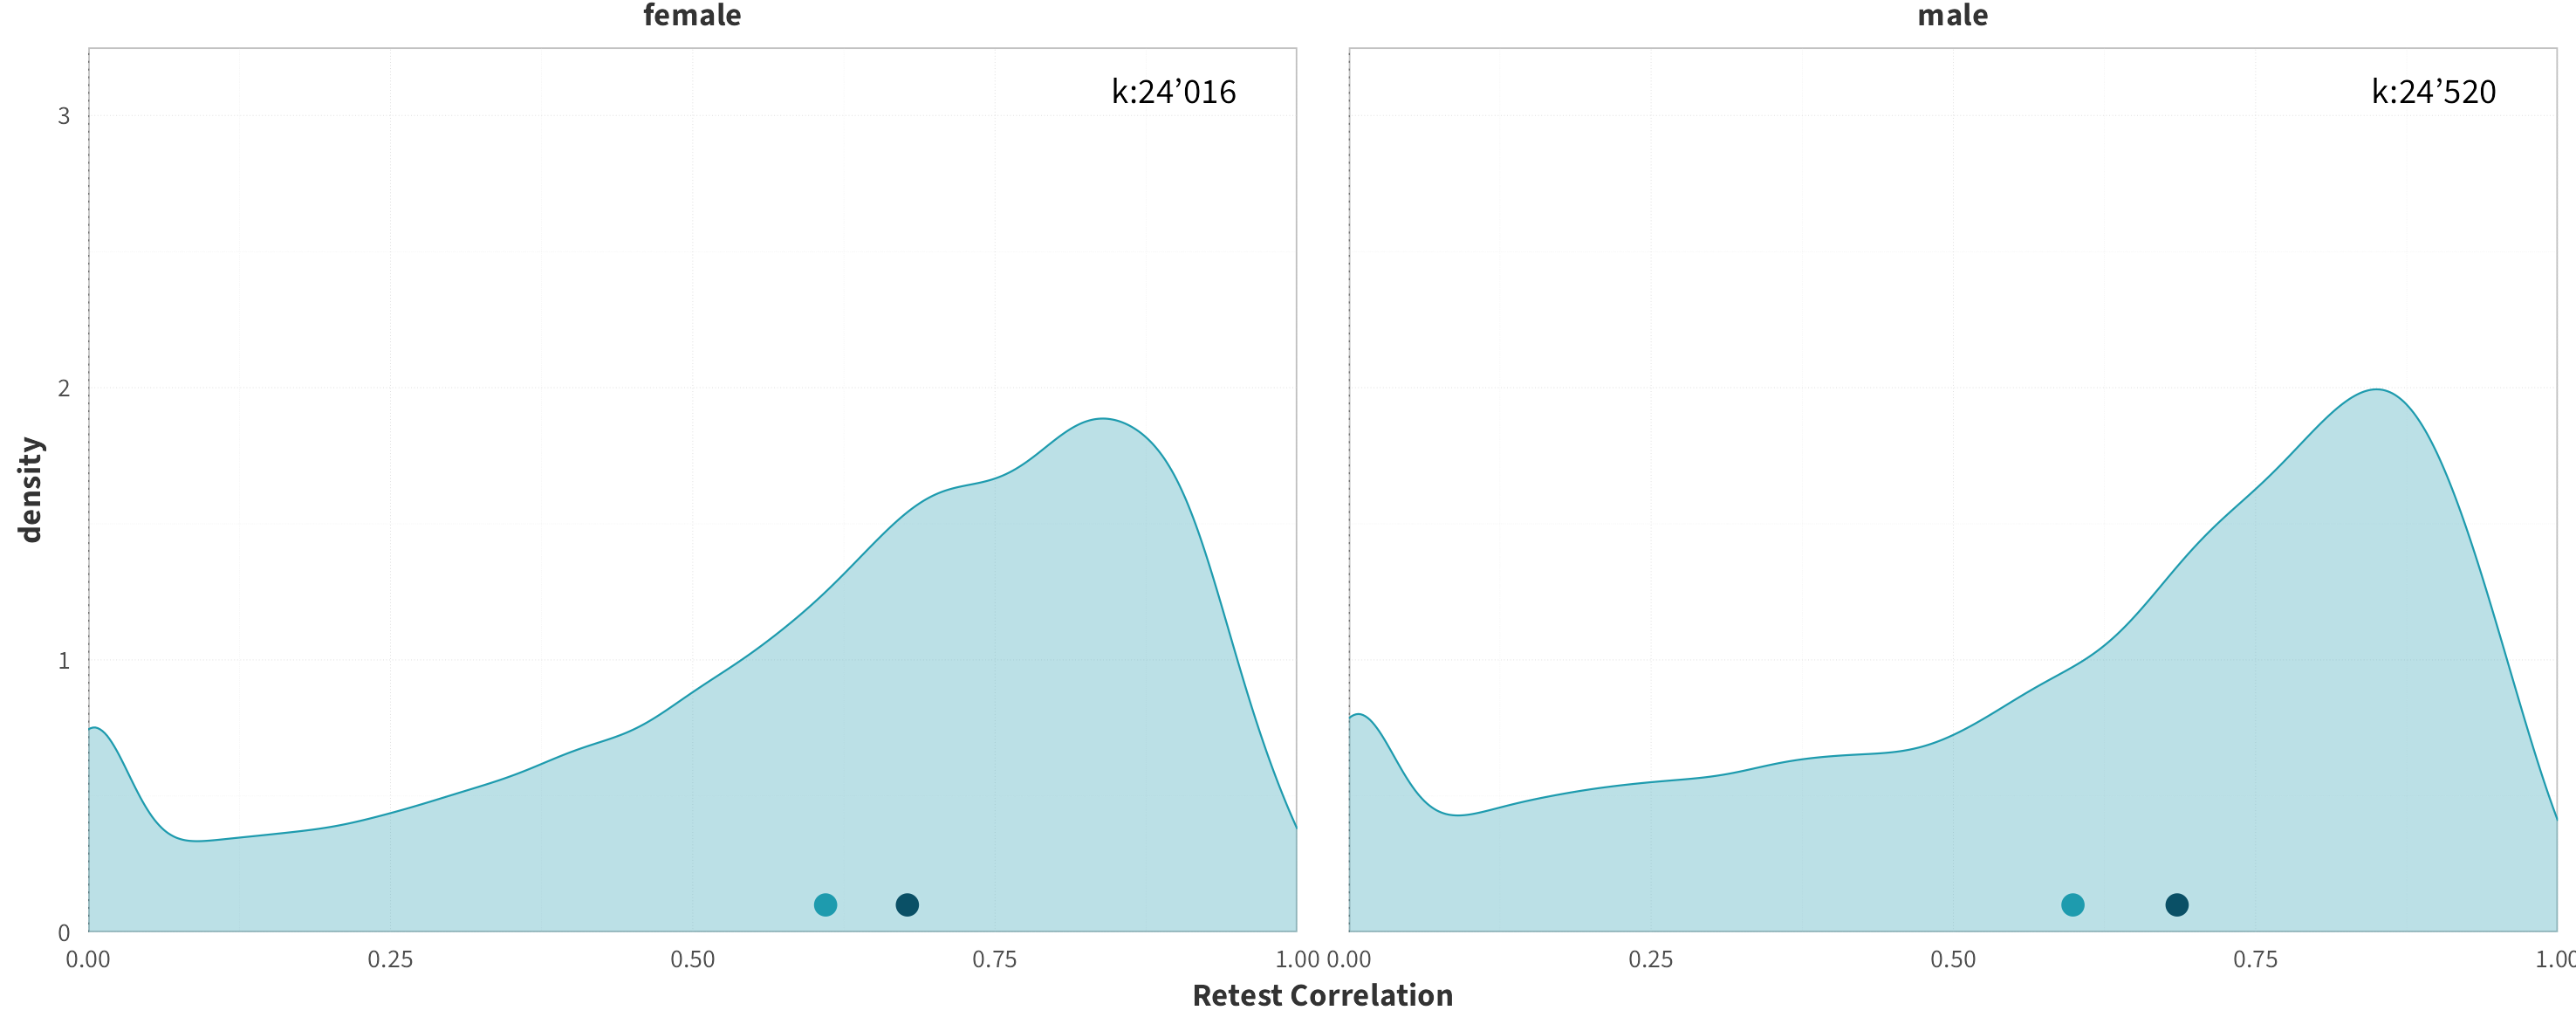
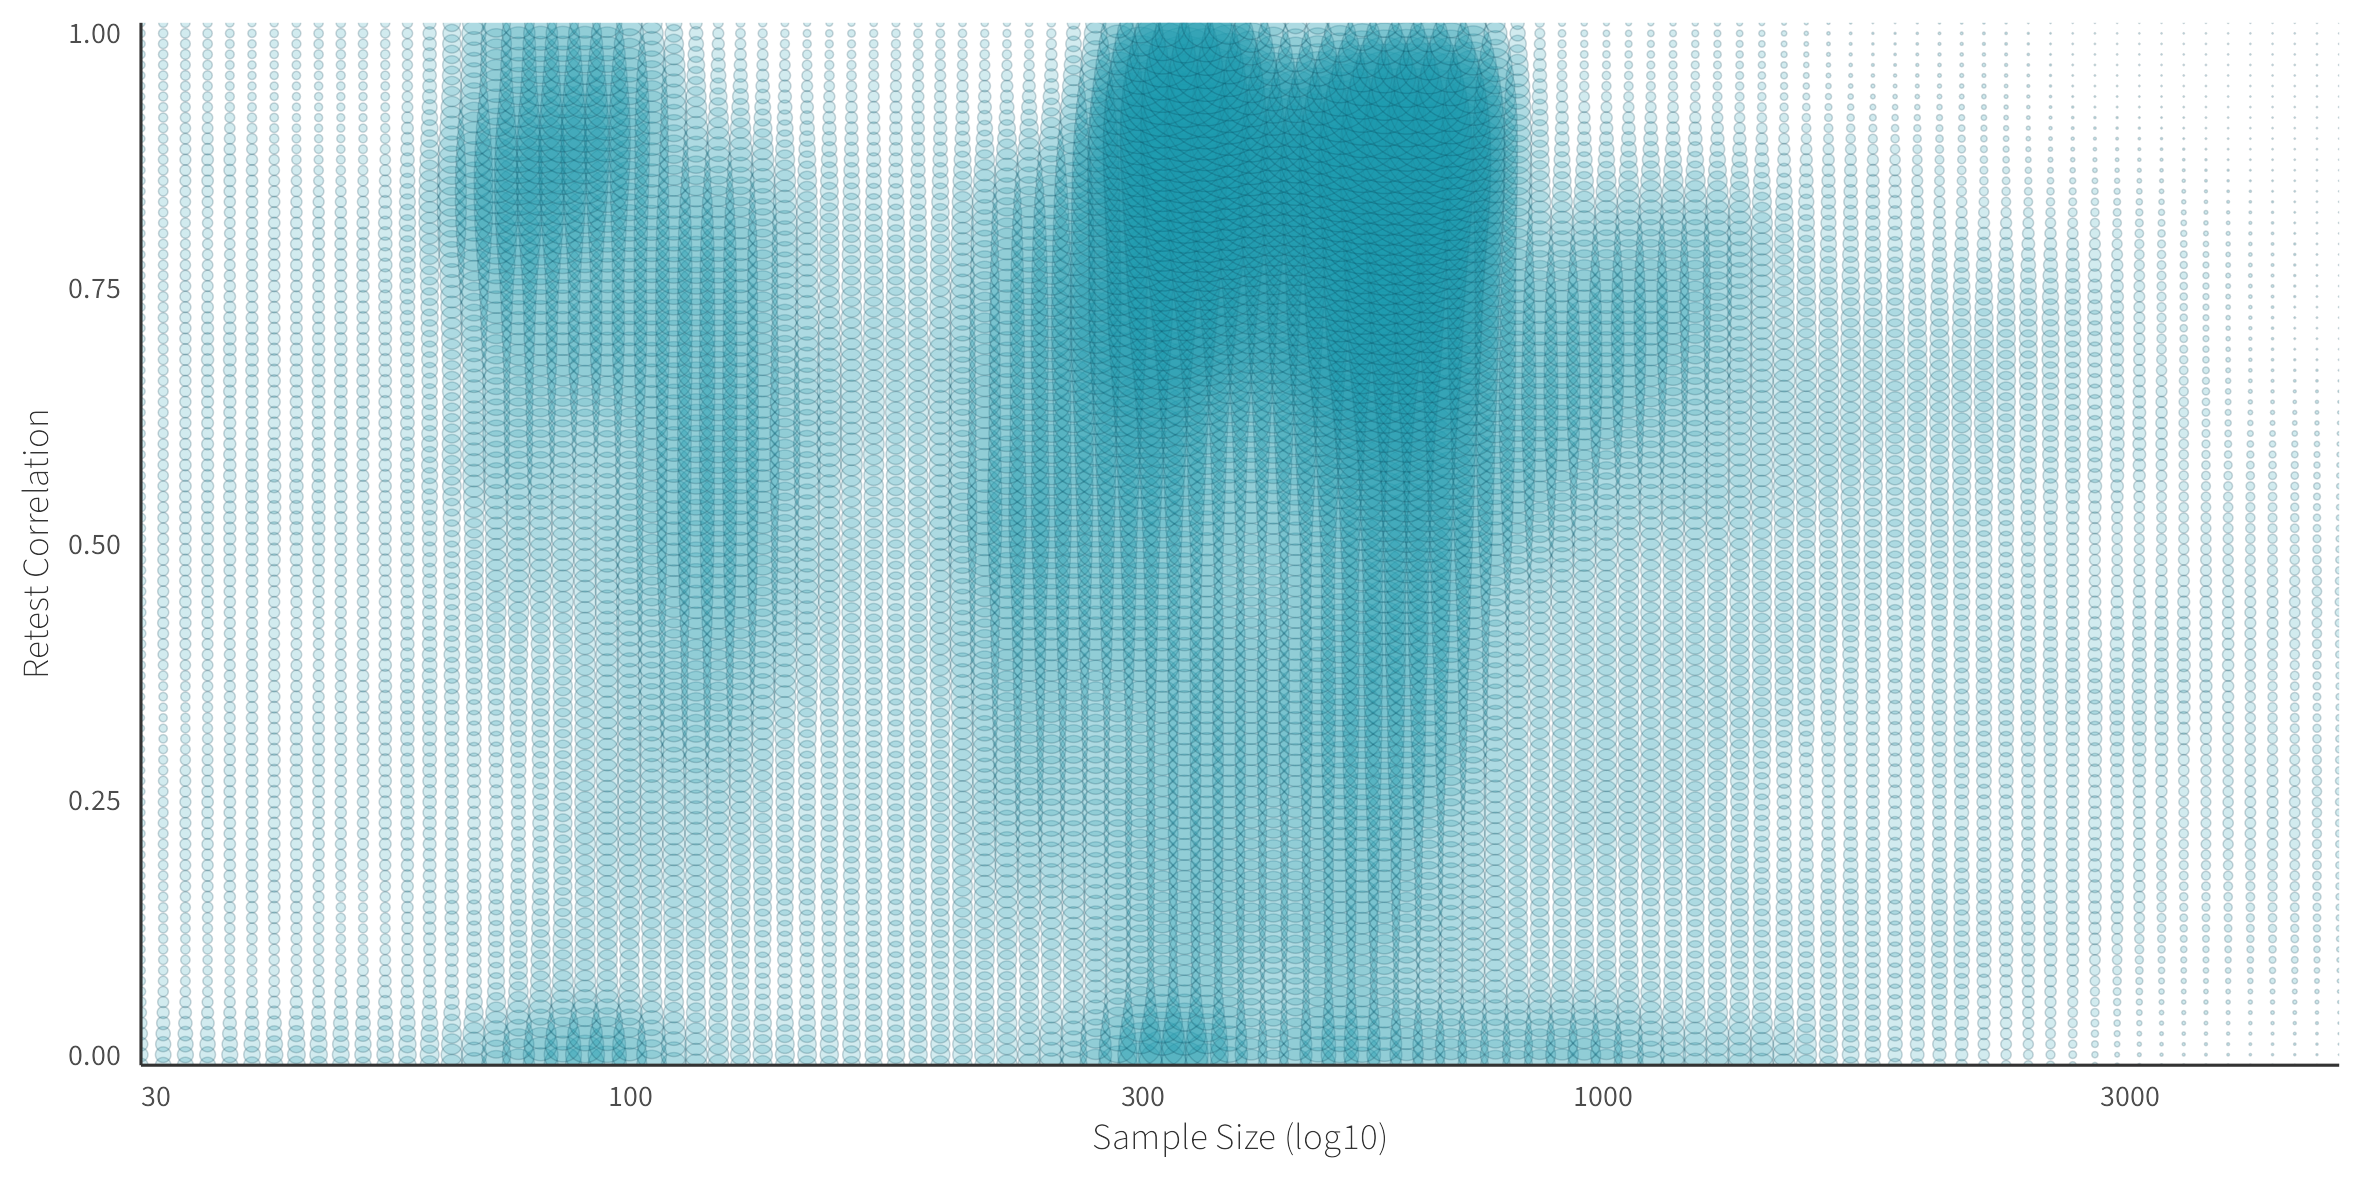
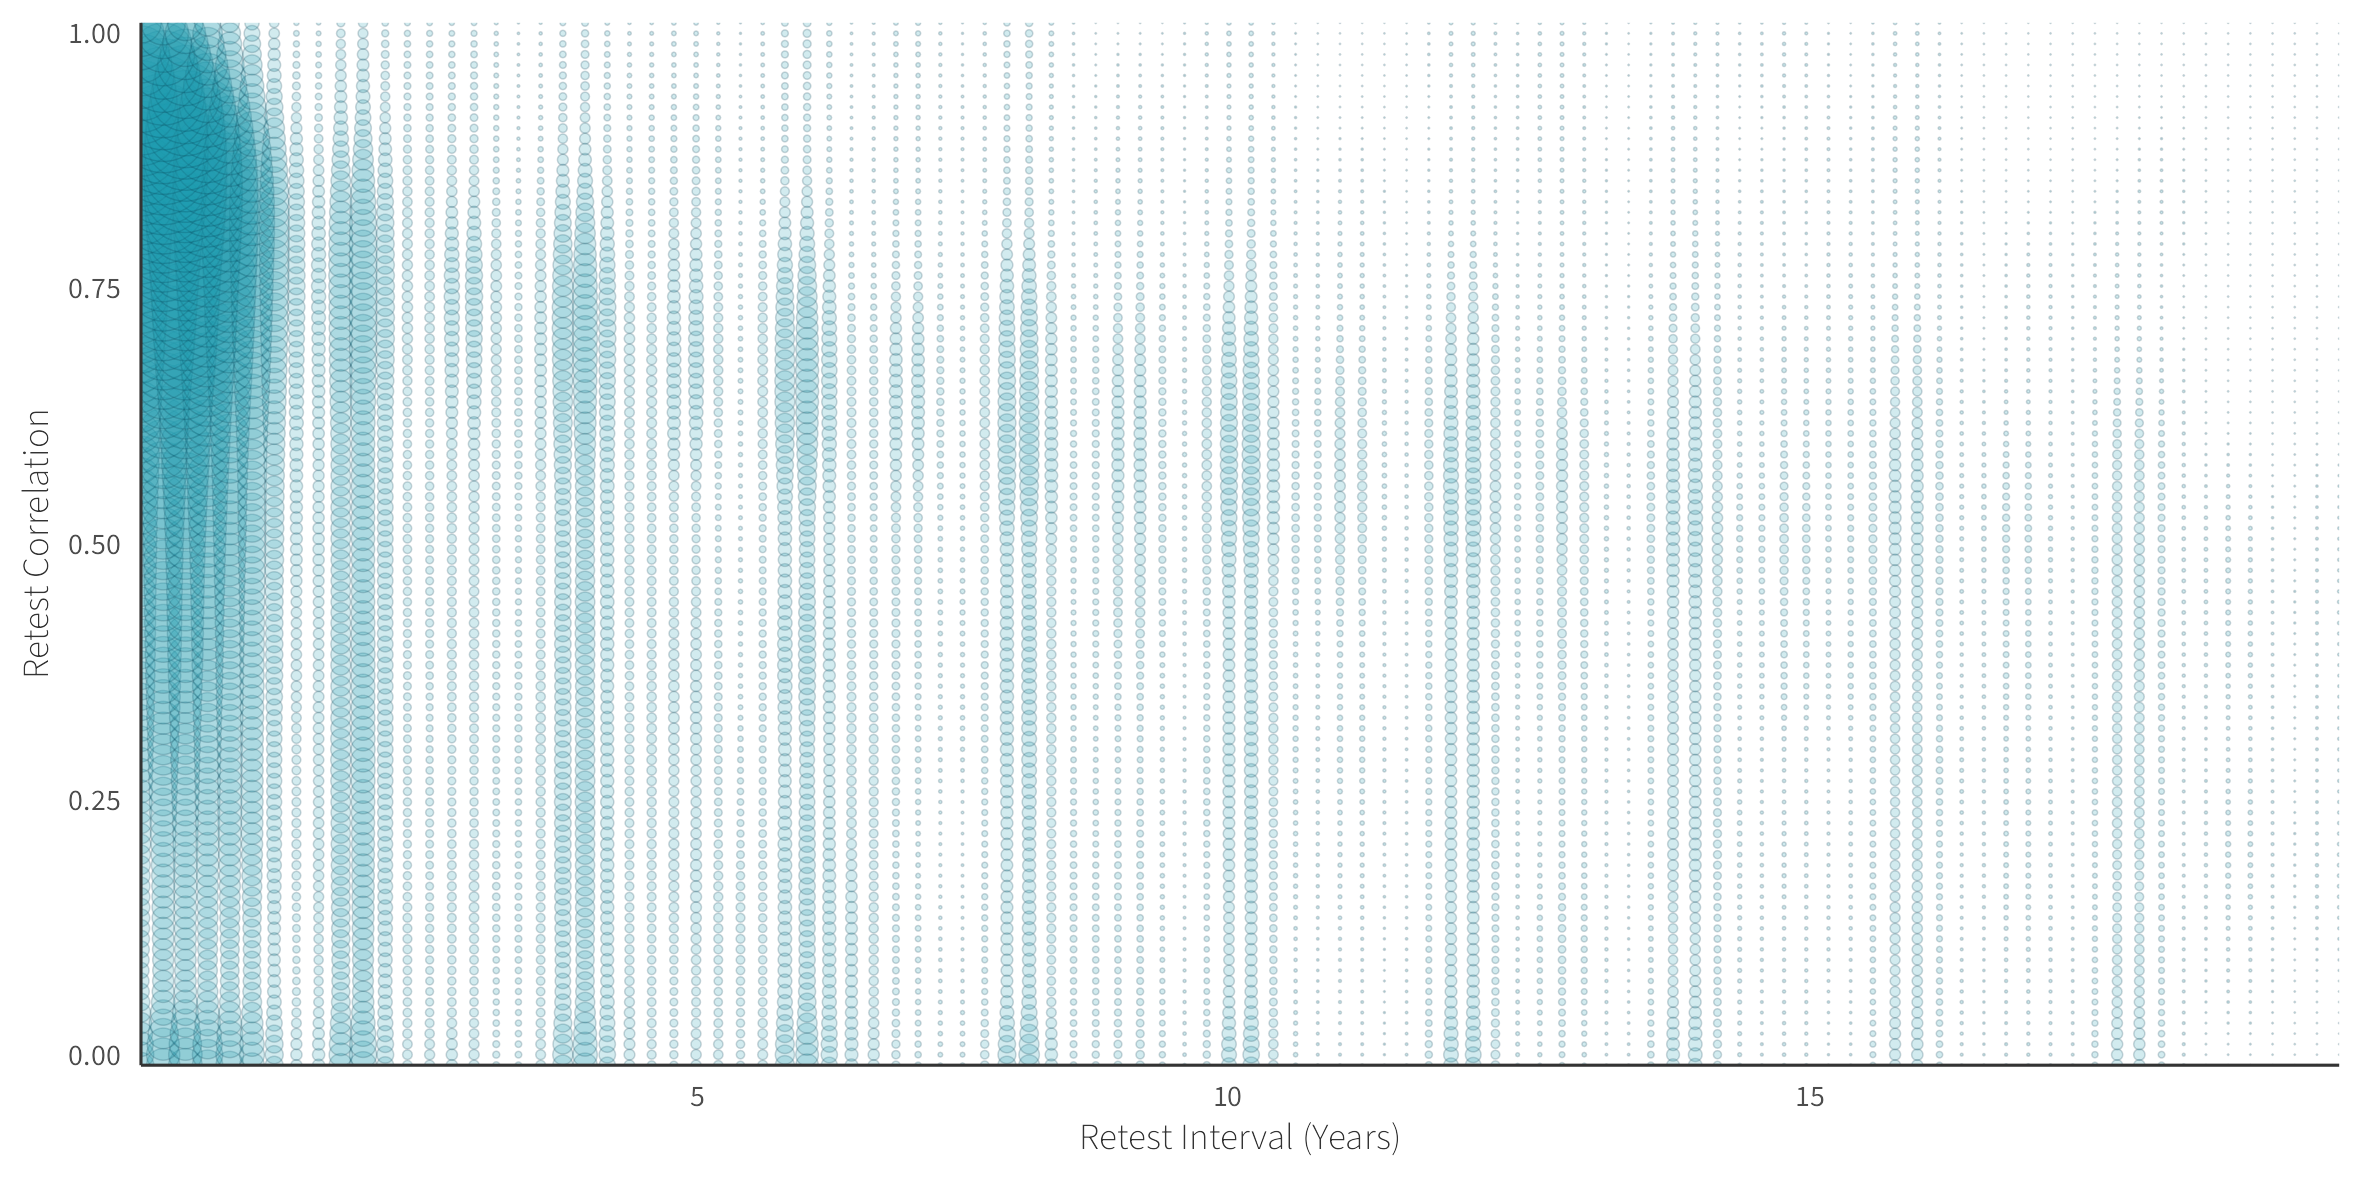
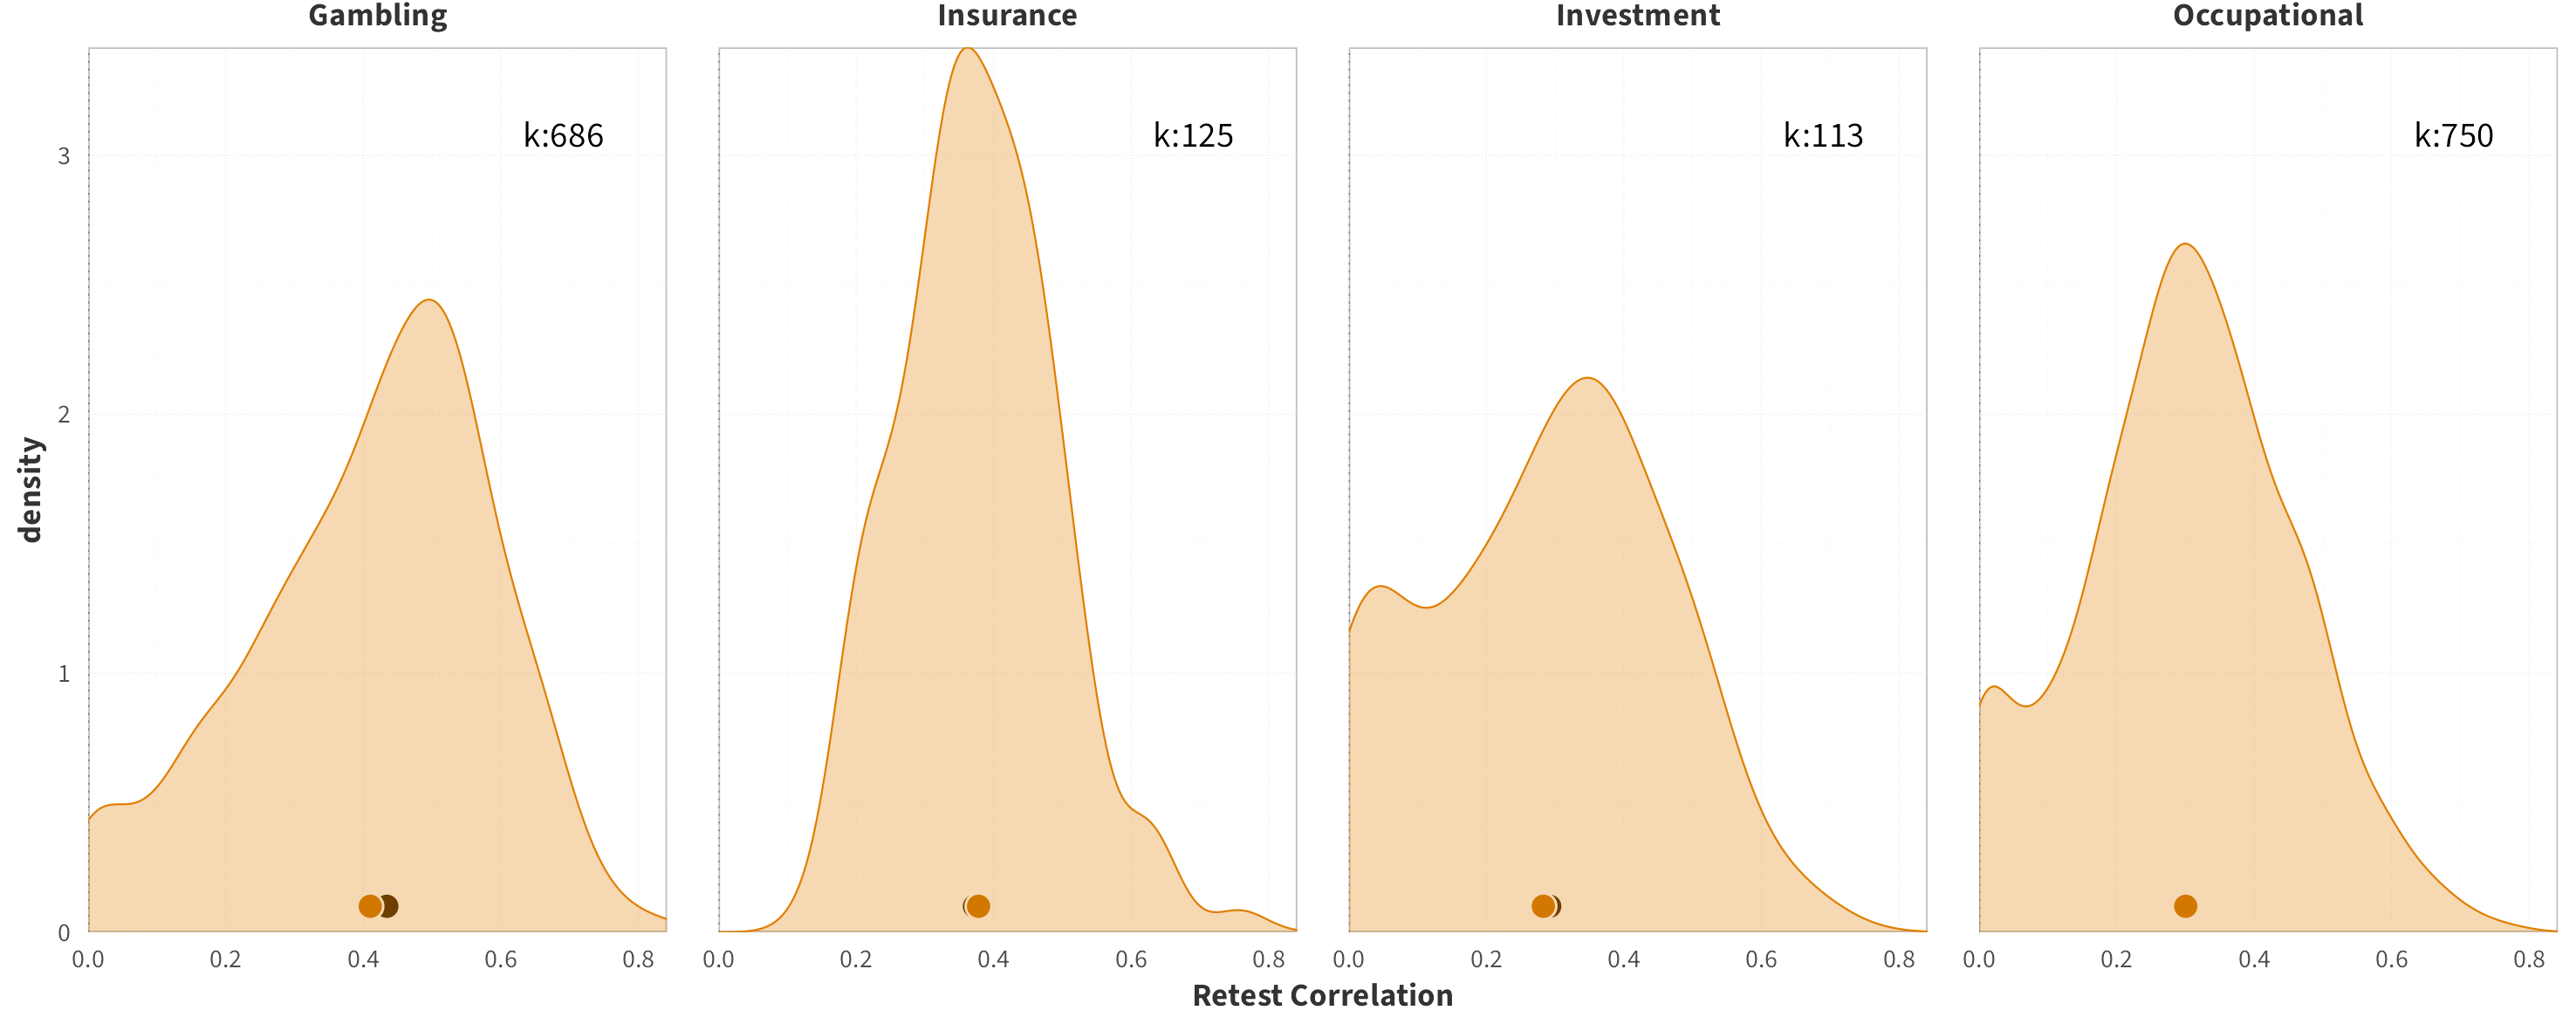
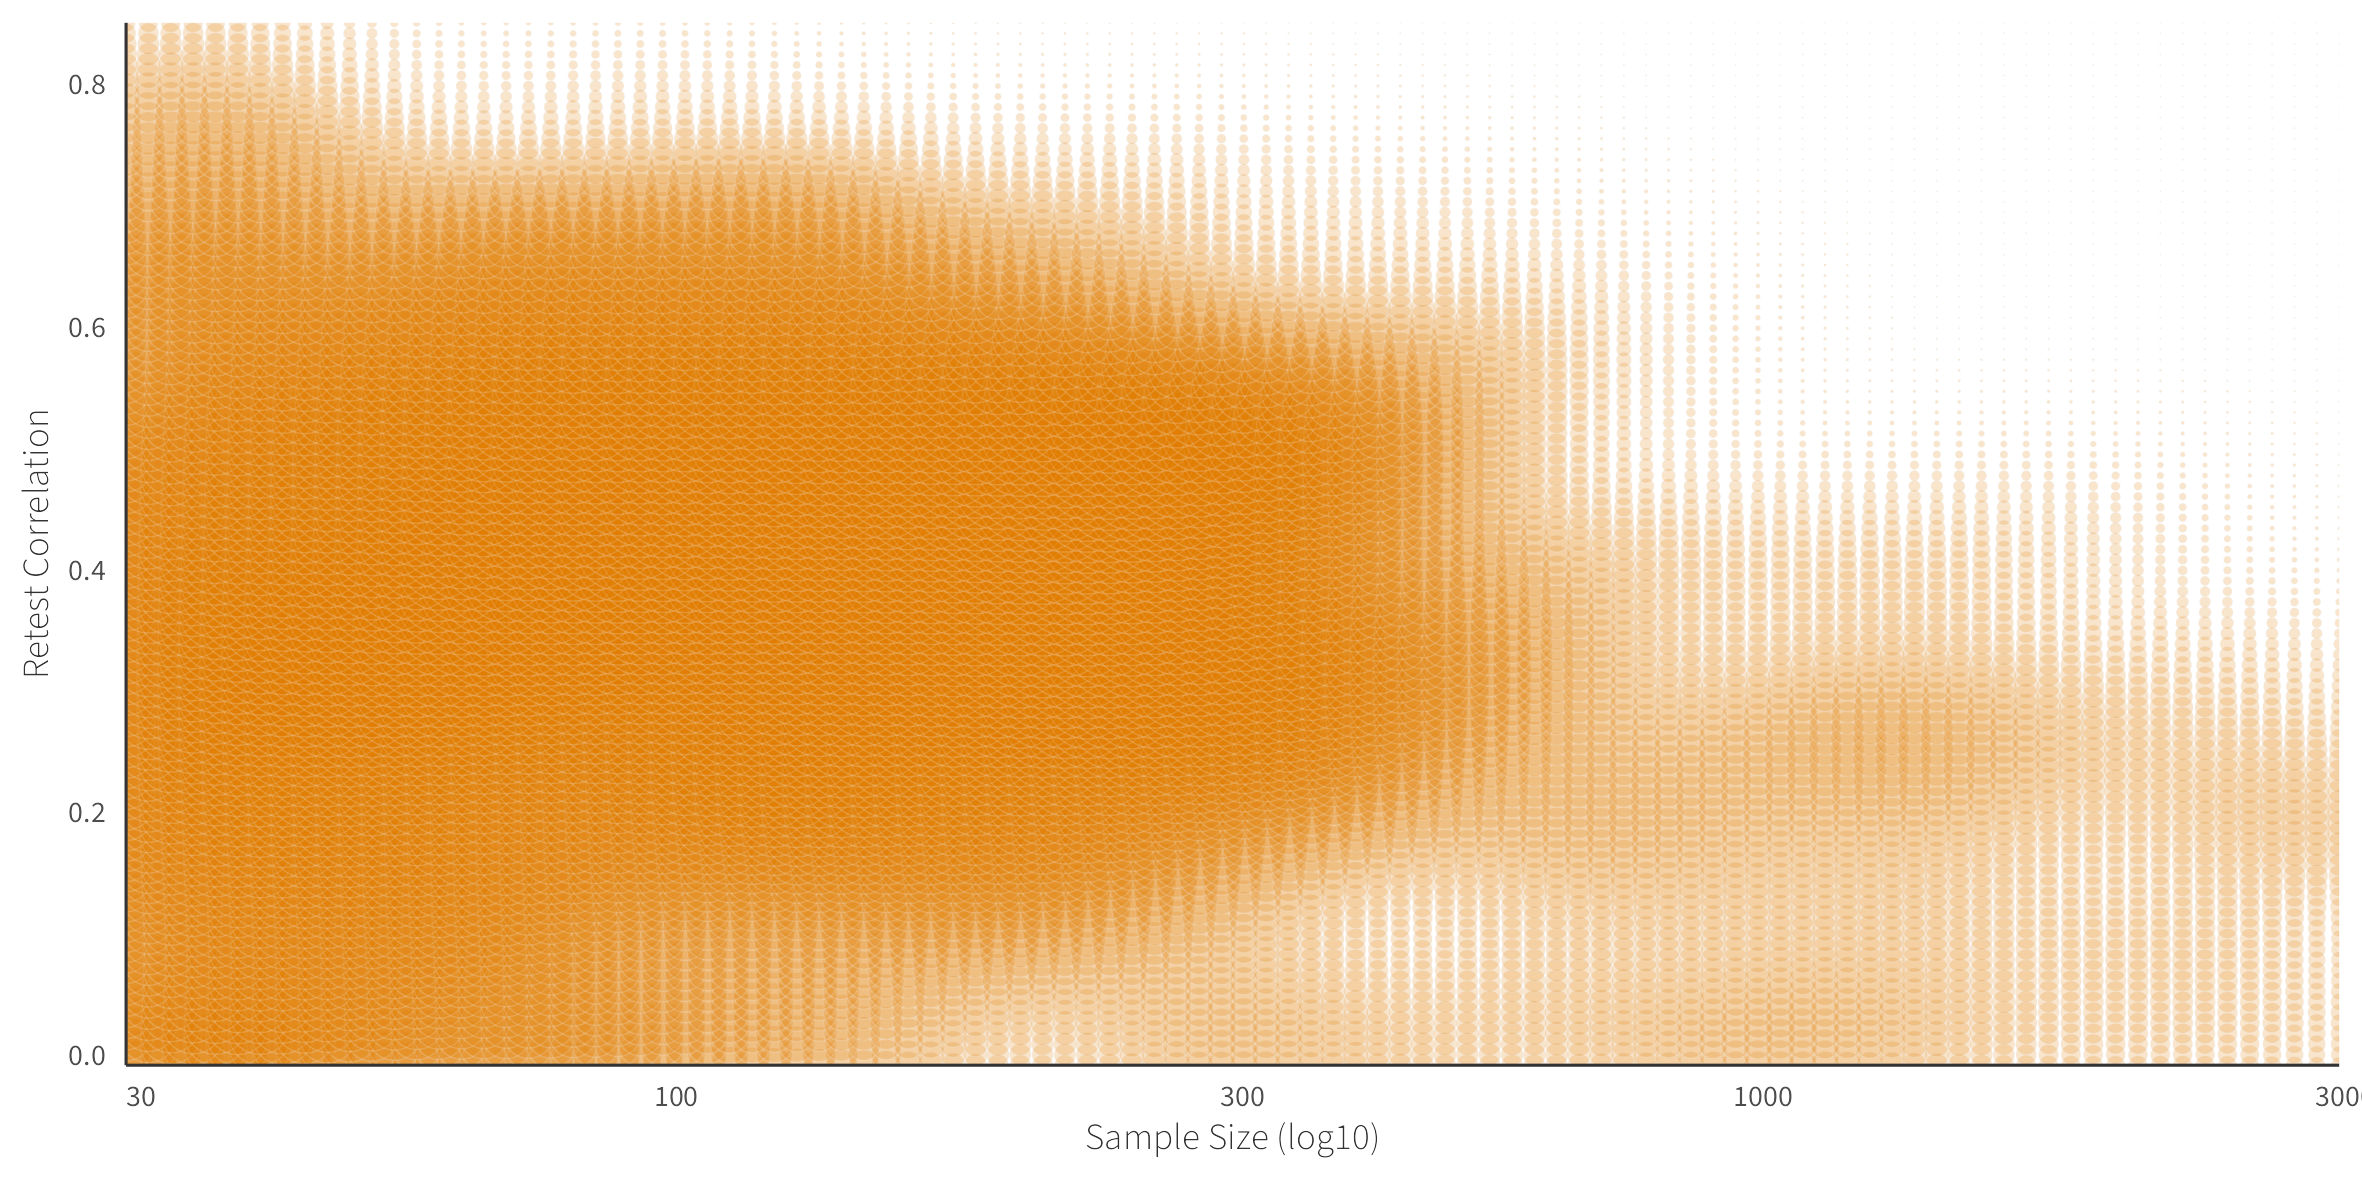
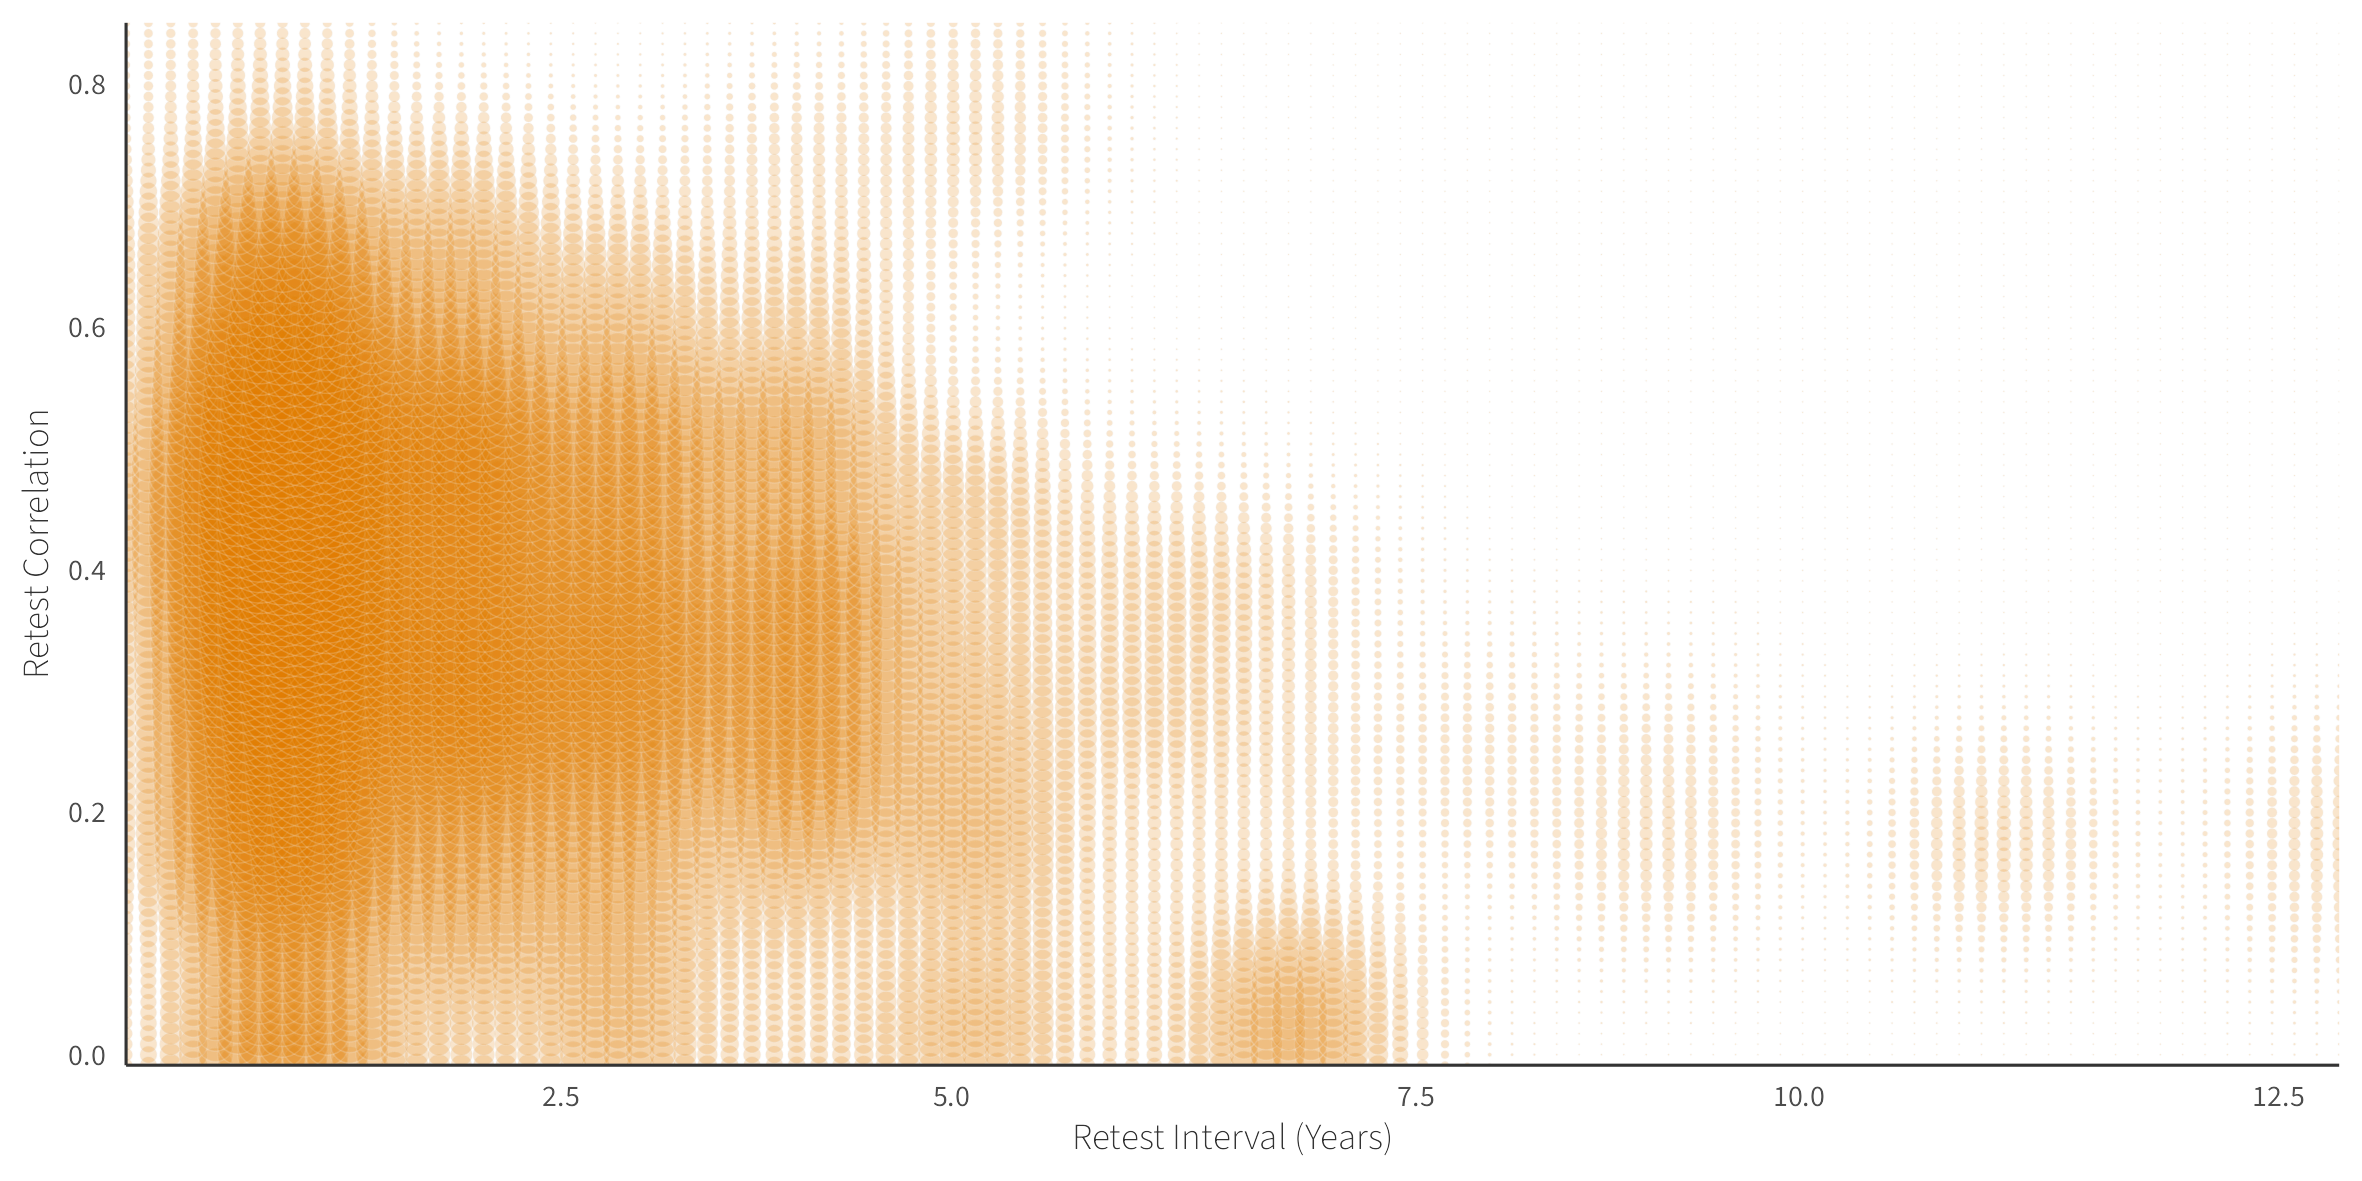
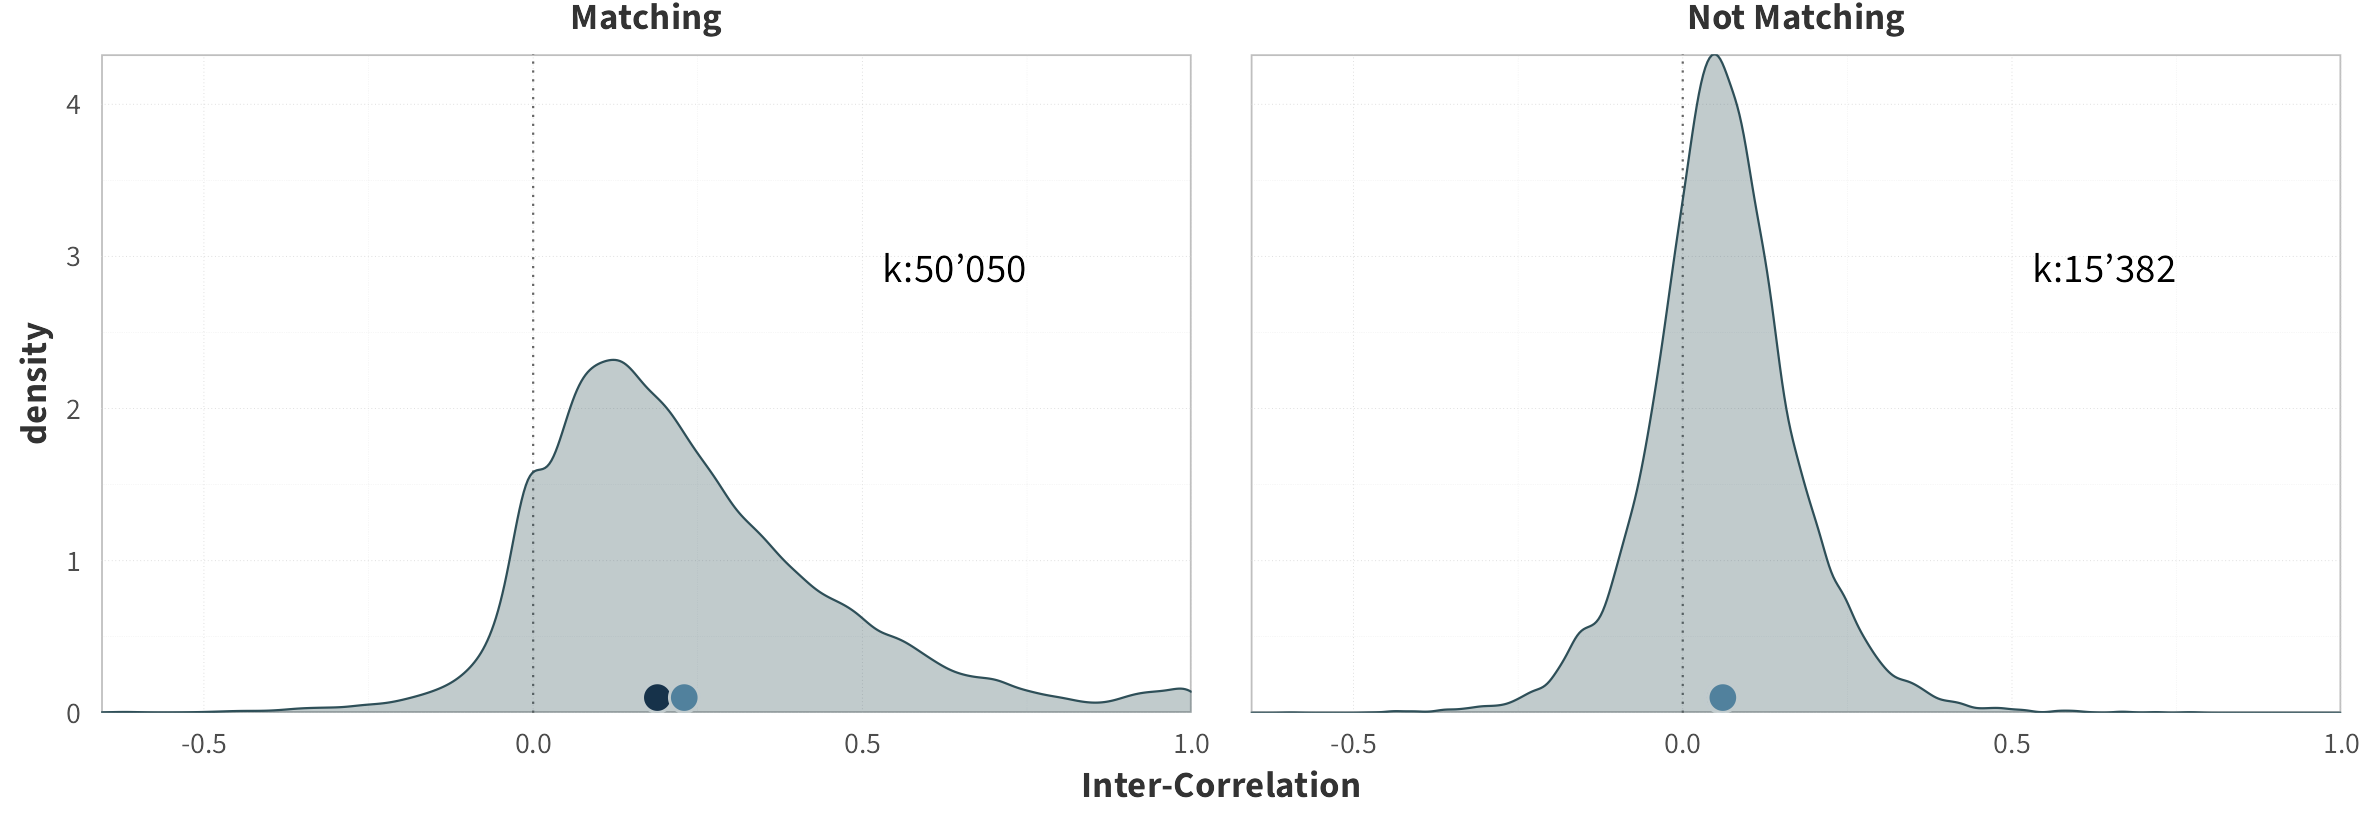
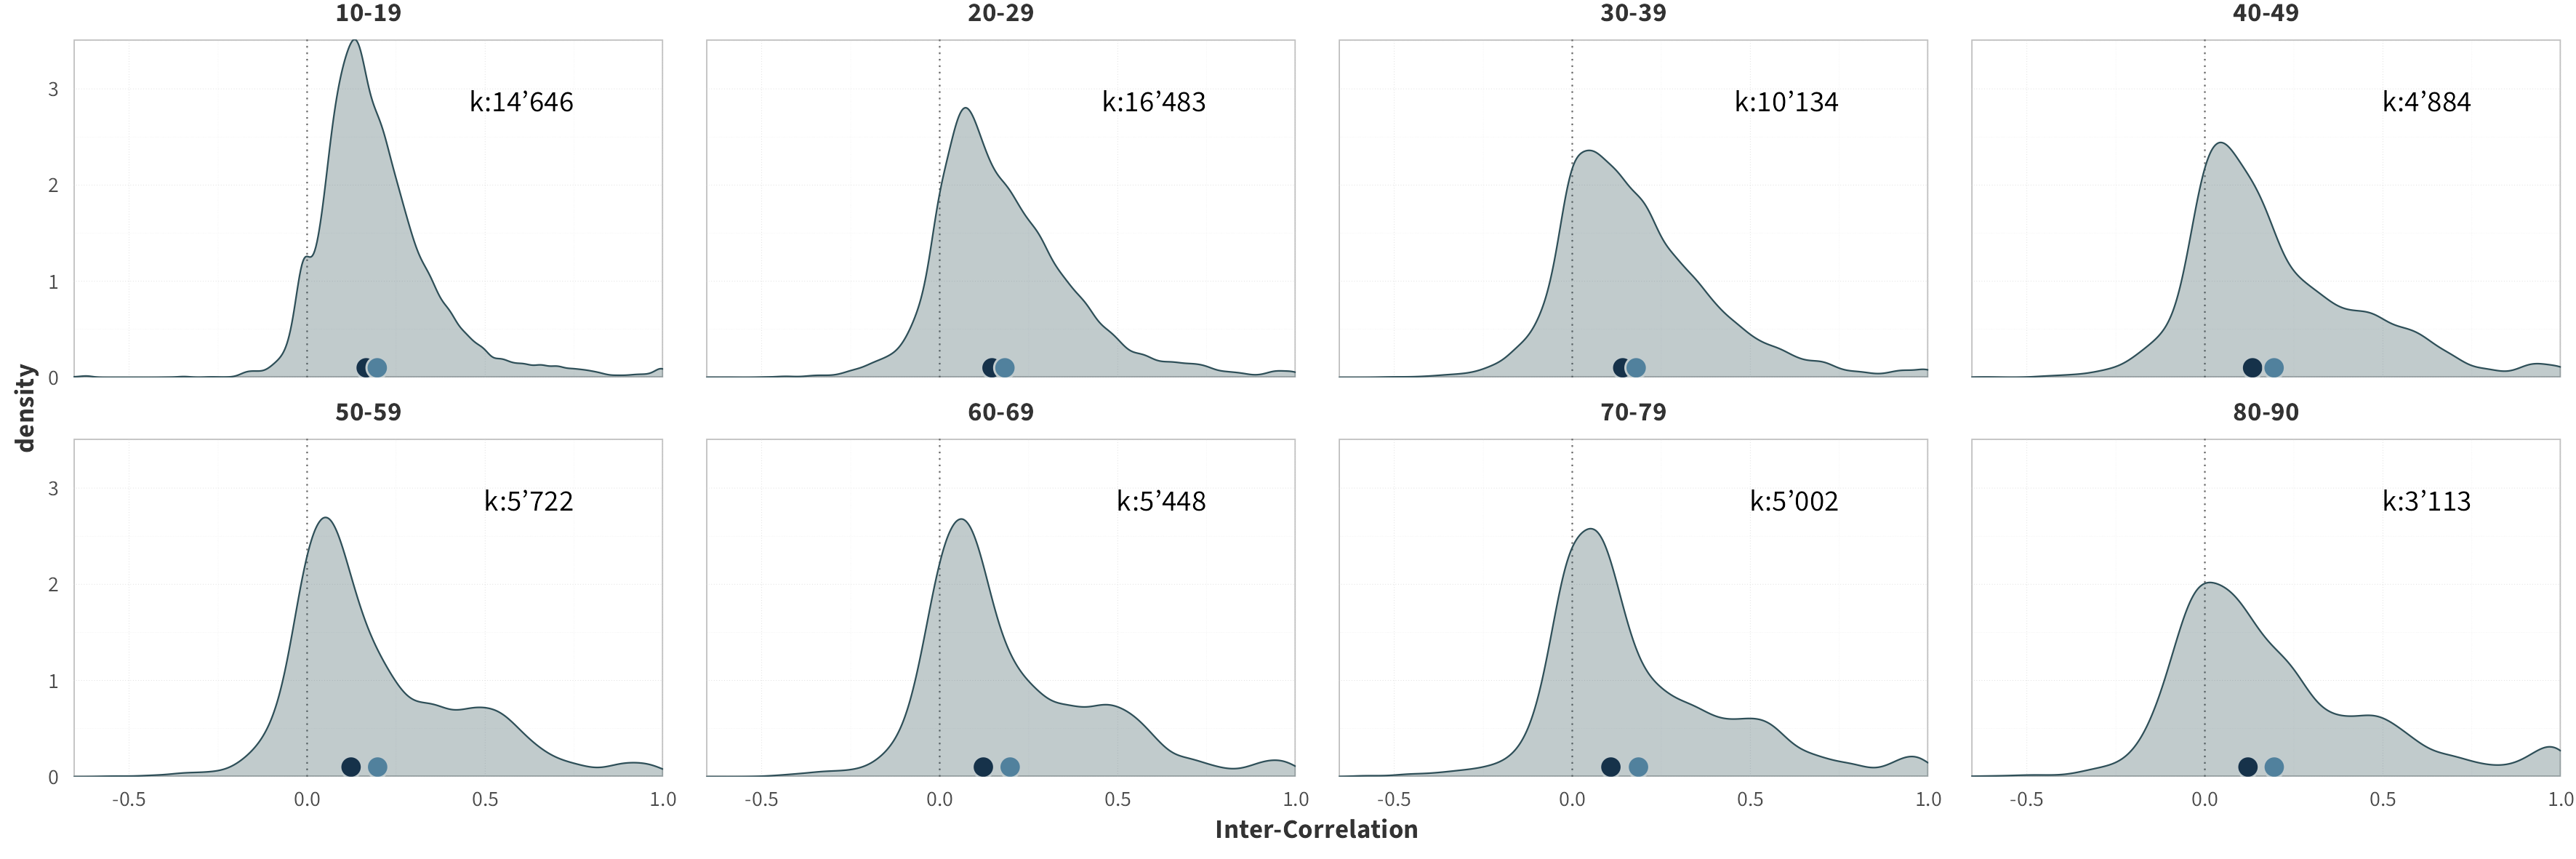
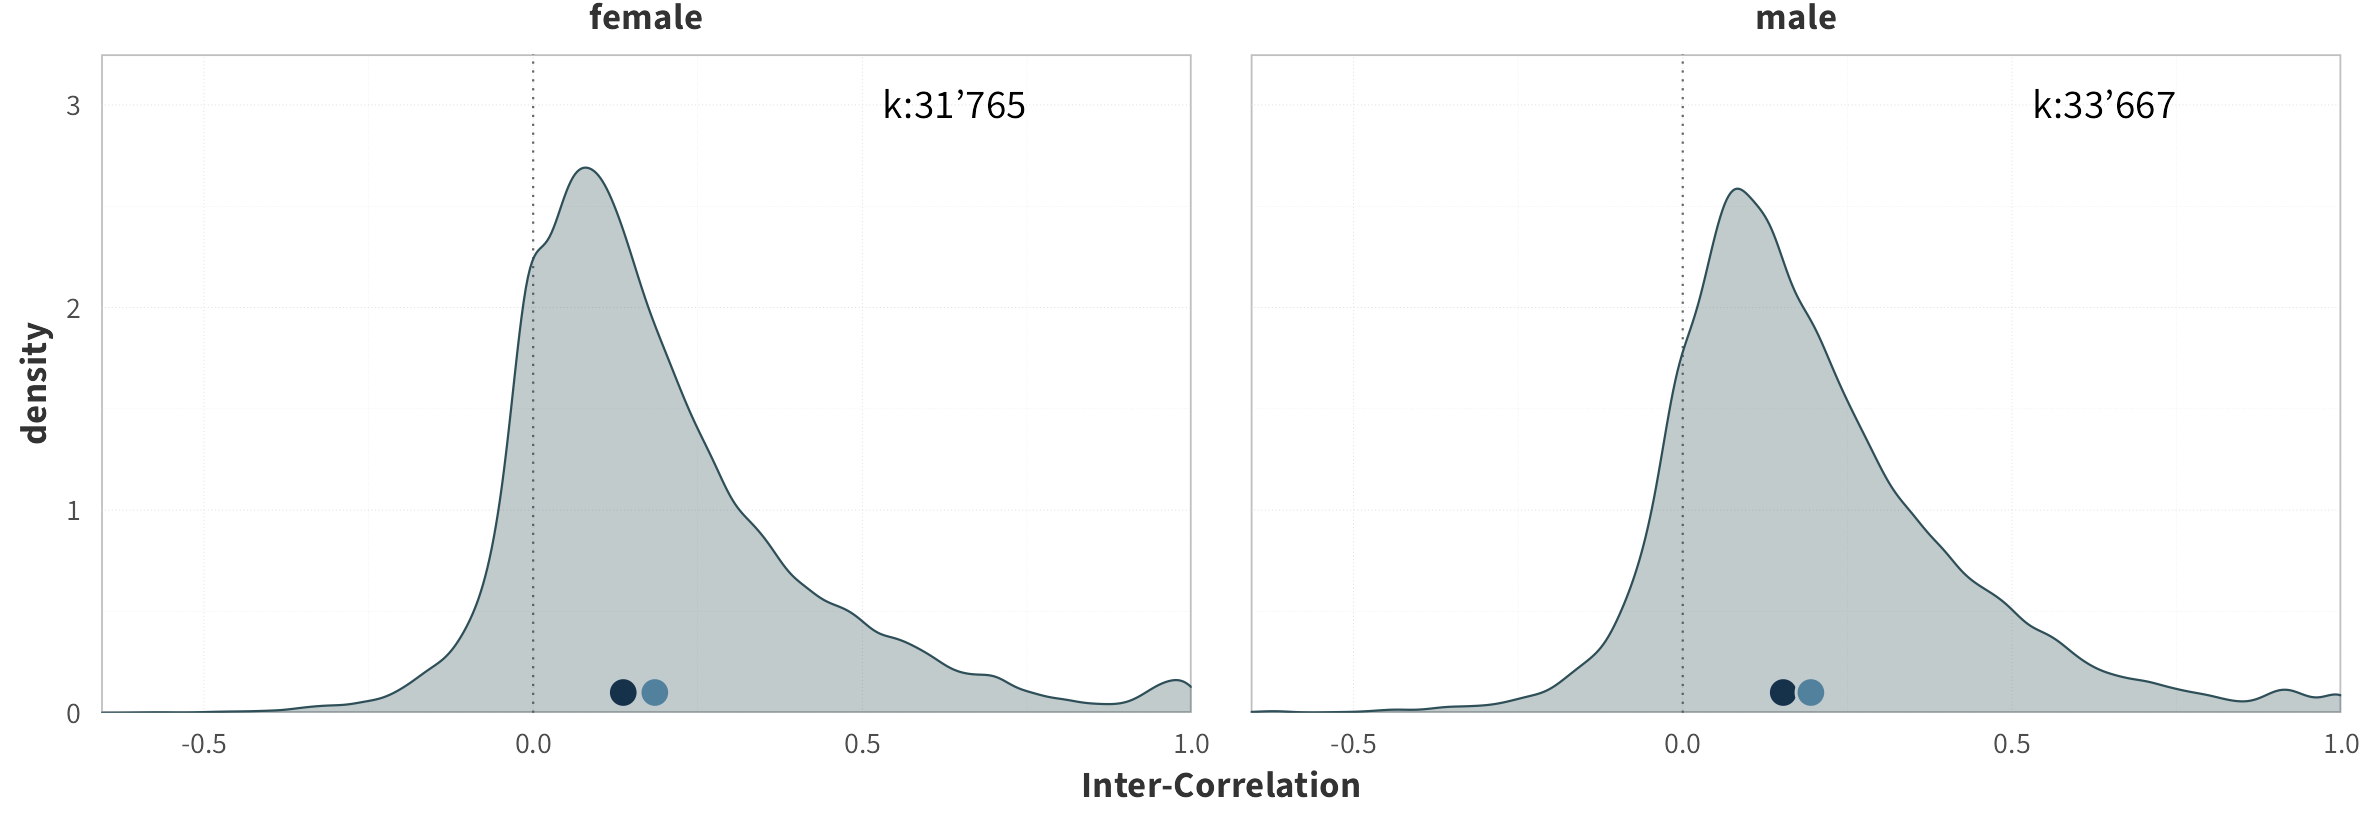
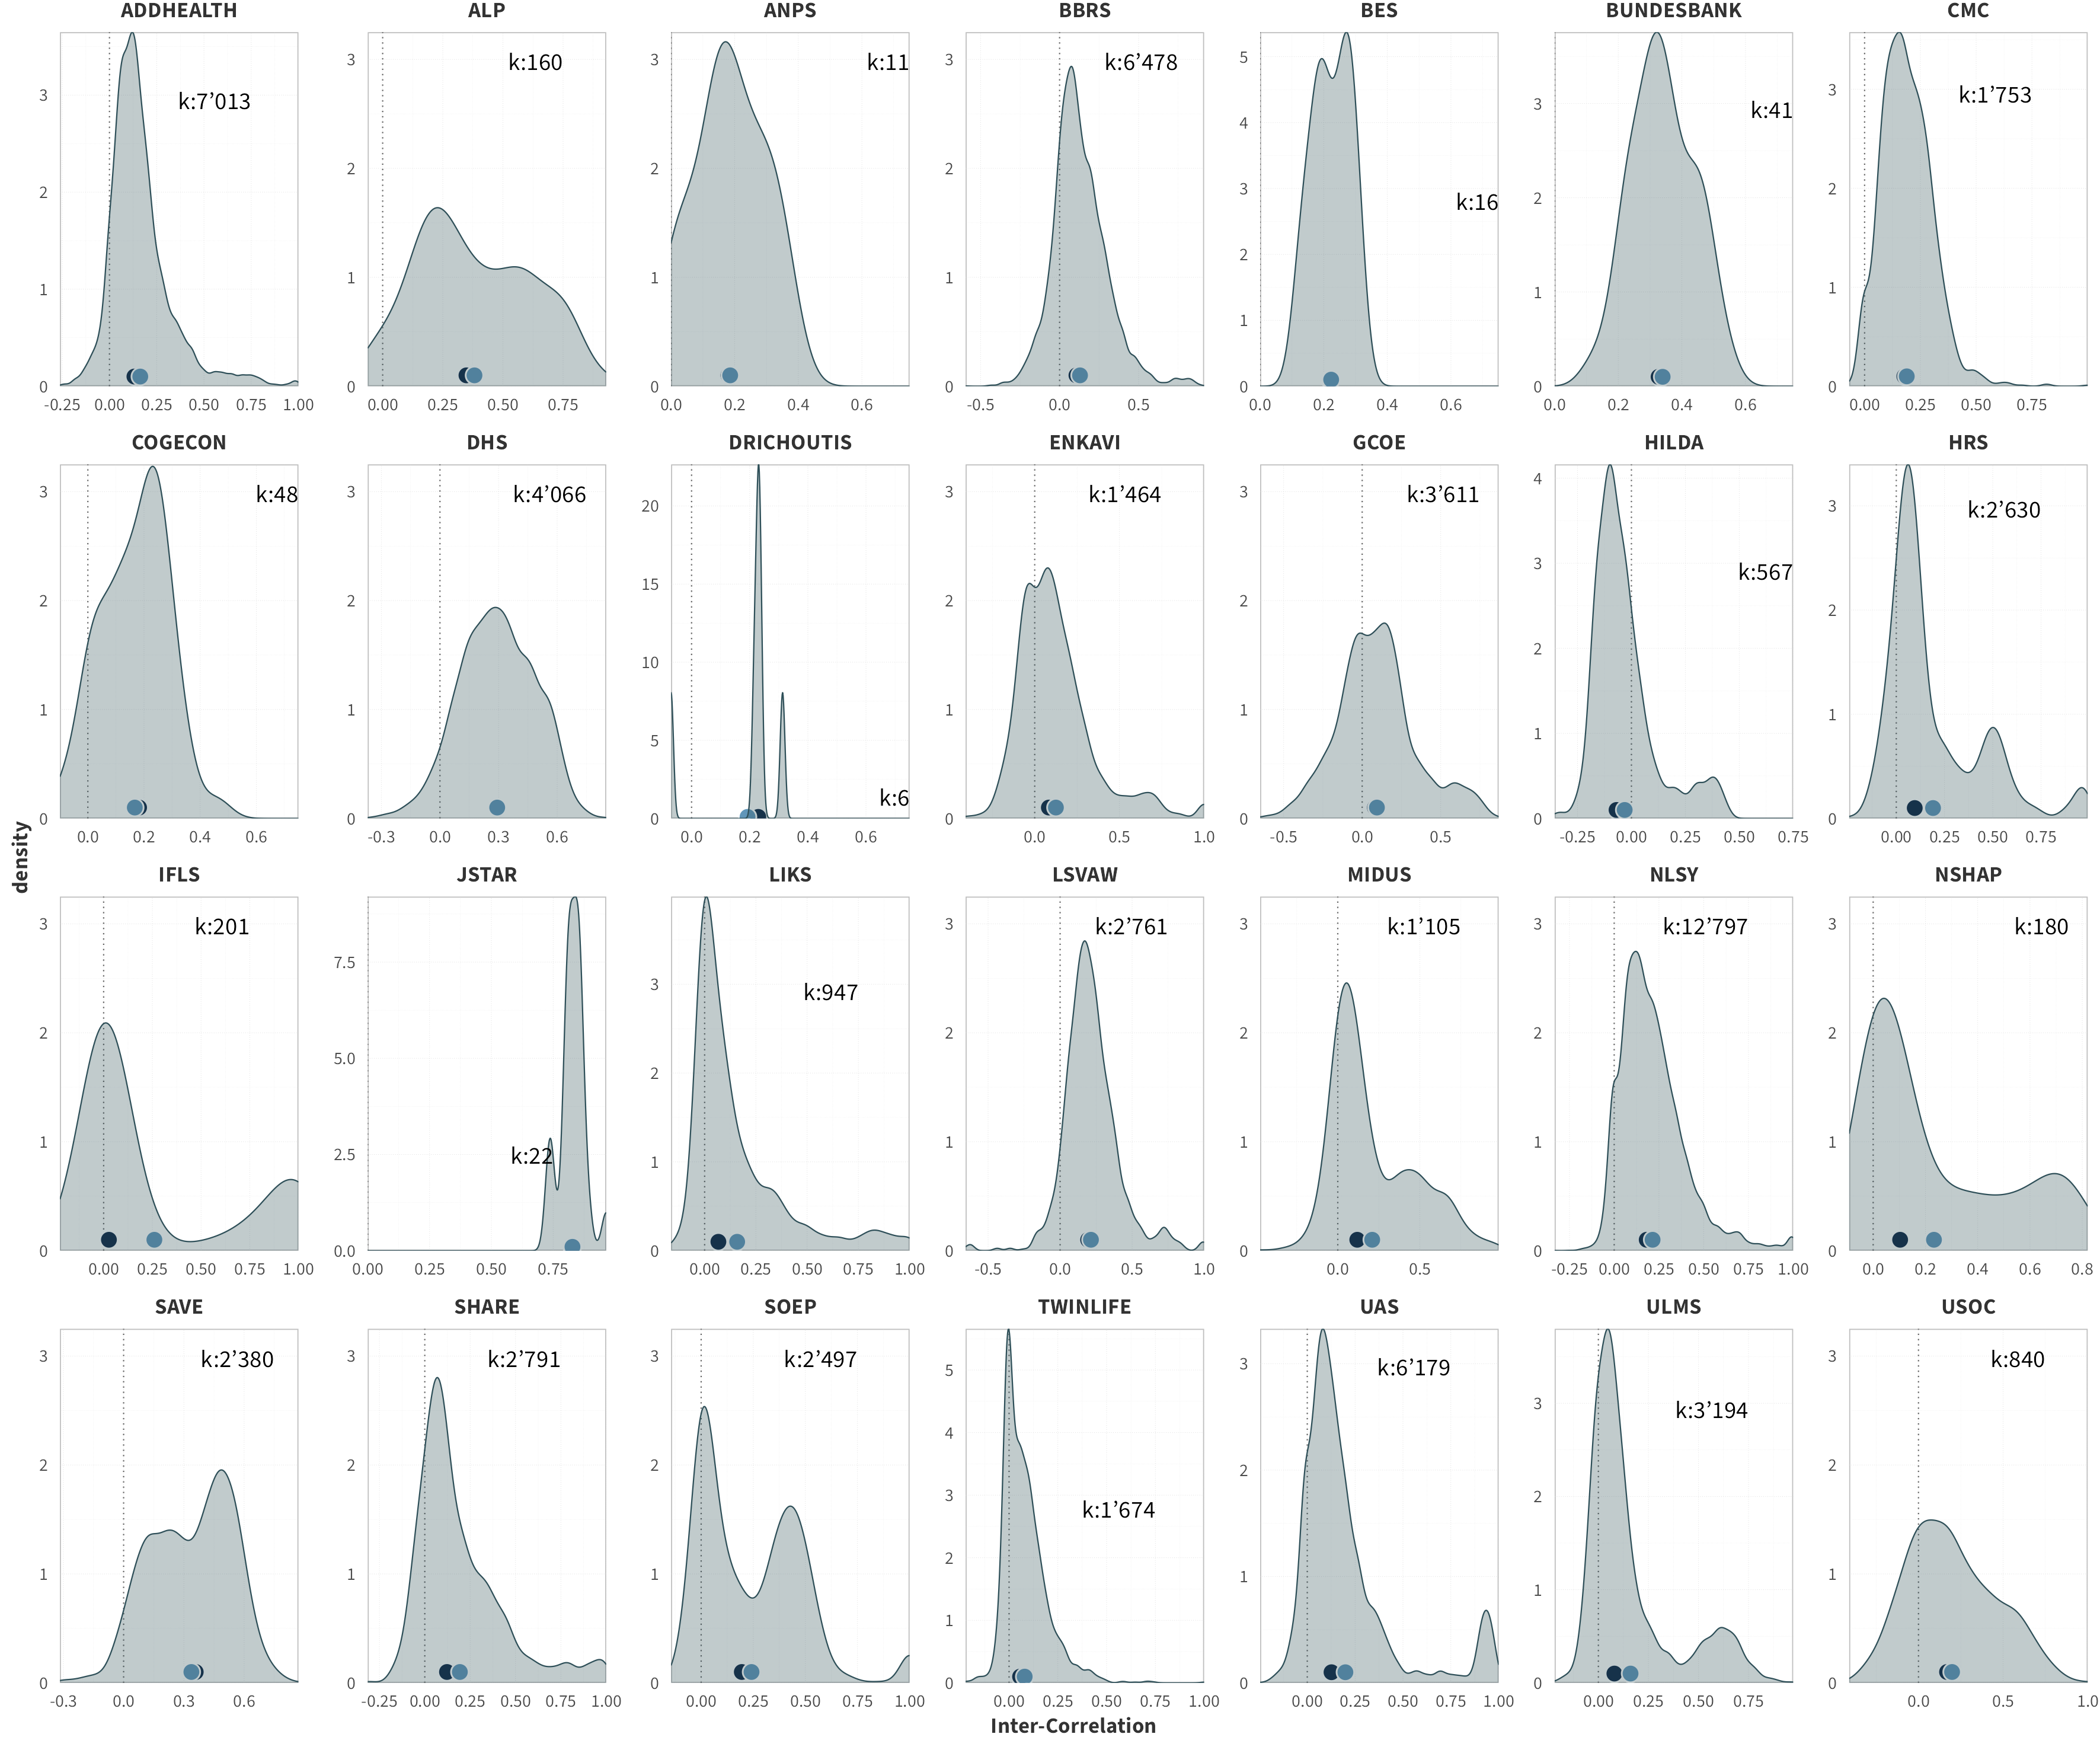
Below, we present an overview of each predictor included in the variance decomposition analysis of the test-retest correlations and inter-correlations. We plot the distributions of the correlations, split into the different levels of each categorical predictor, displaying the mean (light-colored dot) and median (dark-colored dot) values.
Retest-Correlations
Omnibus
By Category

By Domain
By Scale Type
By Age
By Gender
By Panel
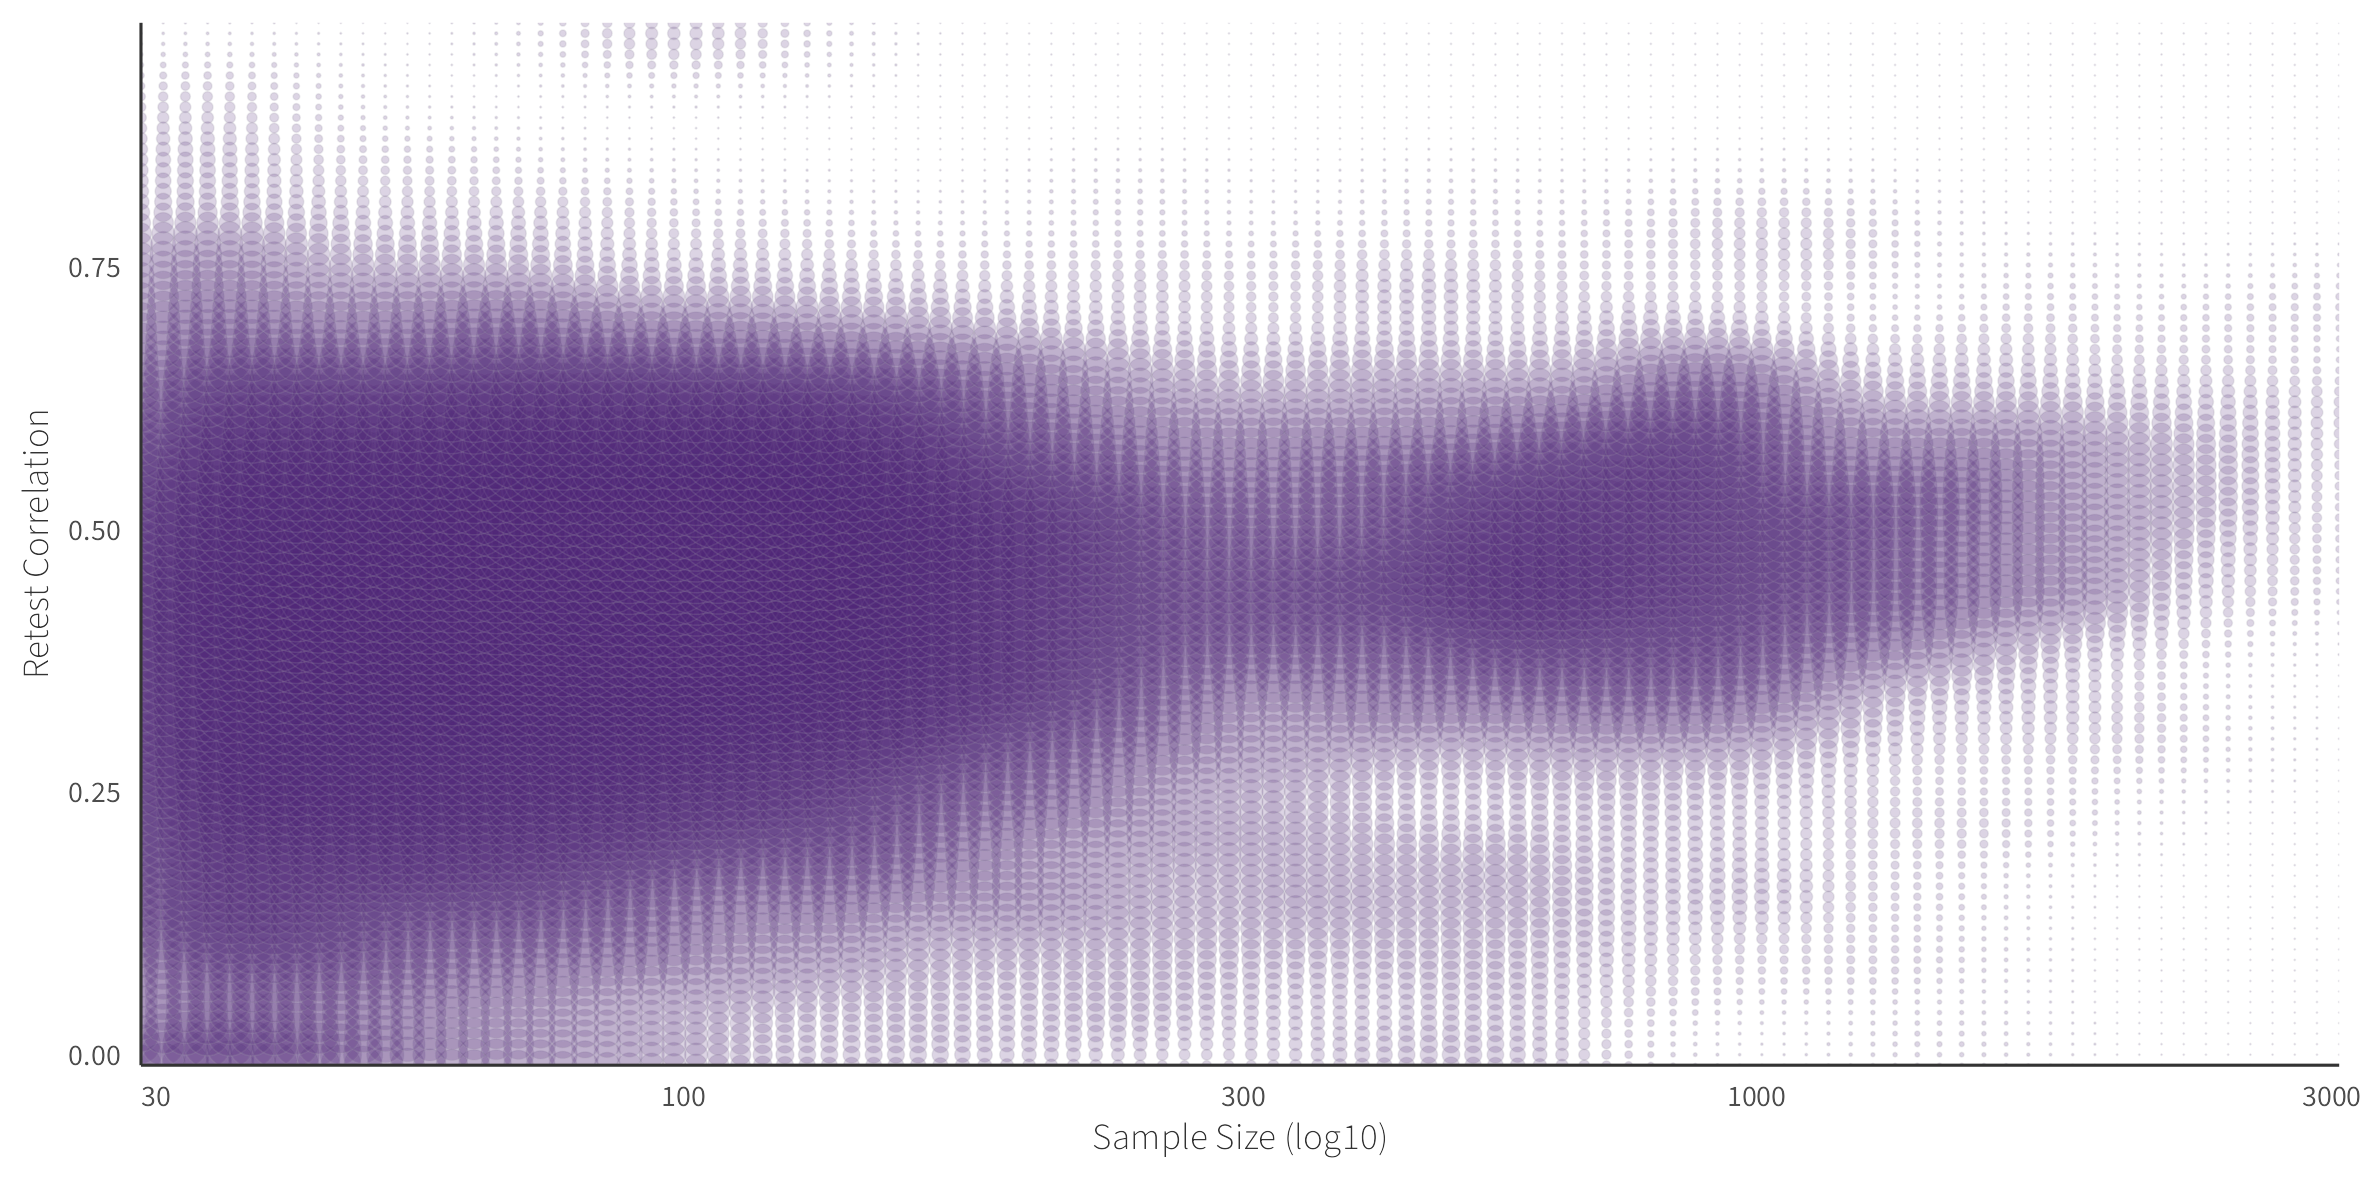
By Sample Size
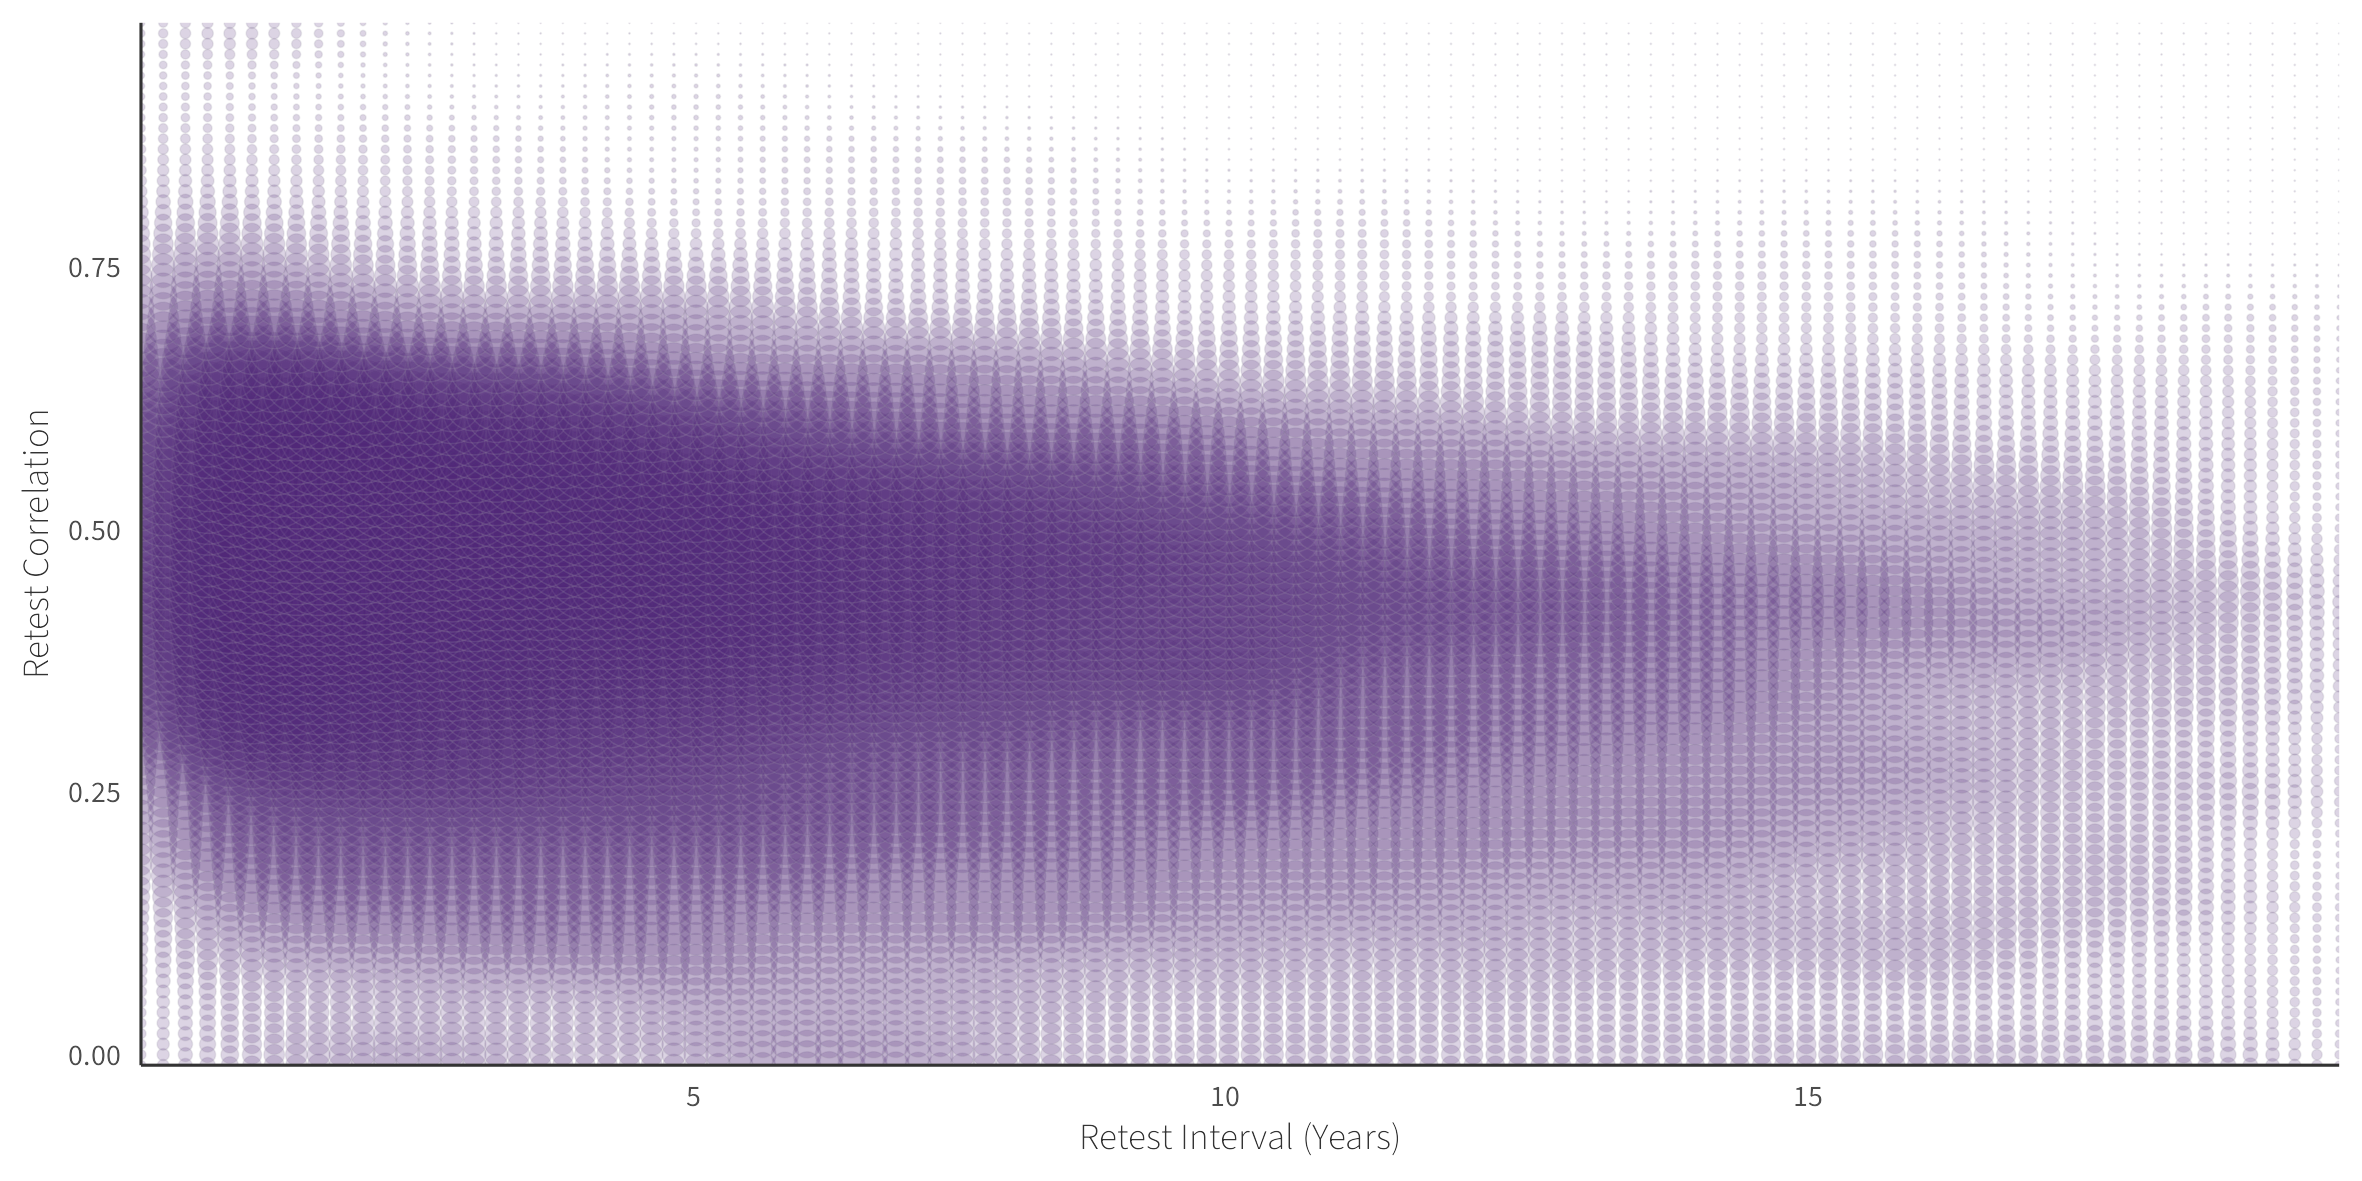
By Retest Interval
Propensity
By Domain
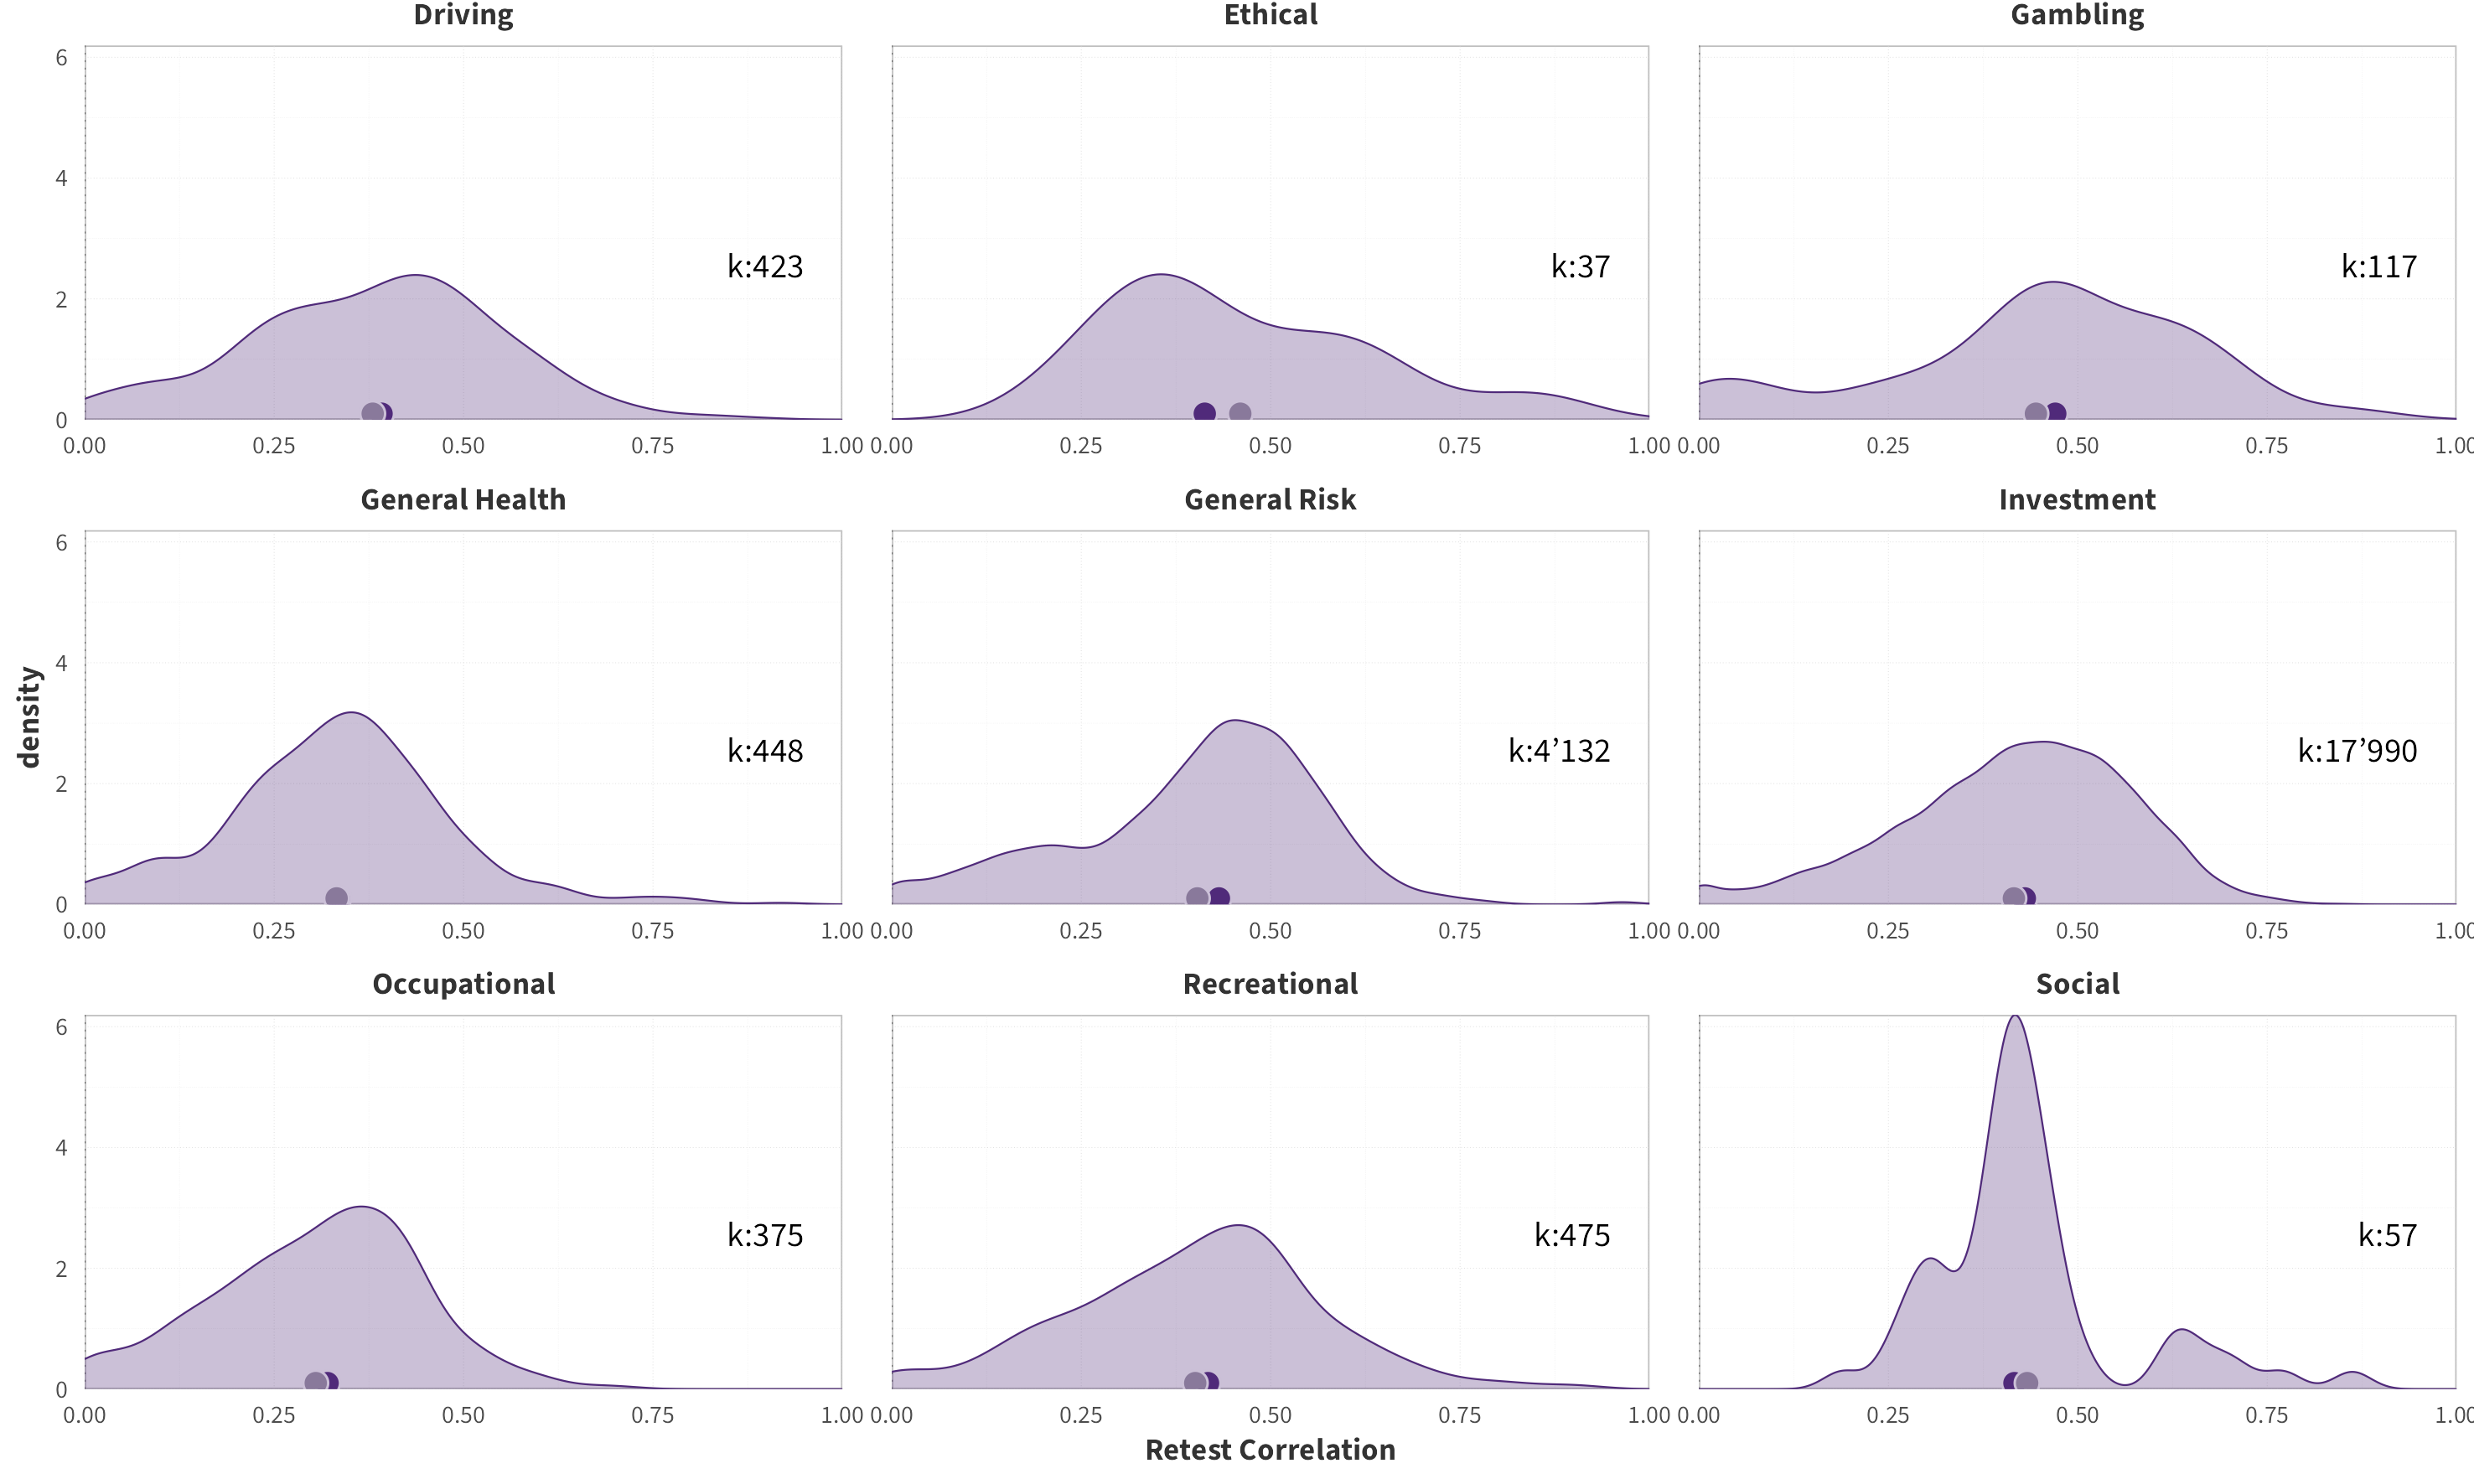
By Scale Type
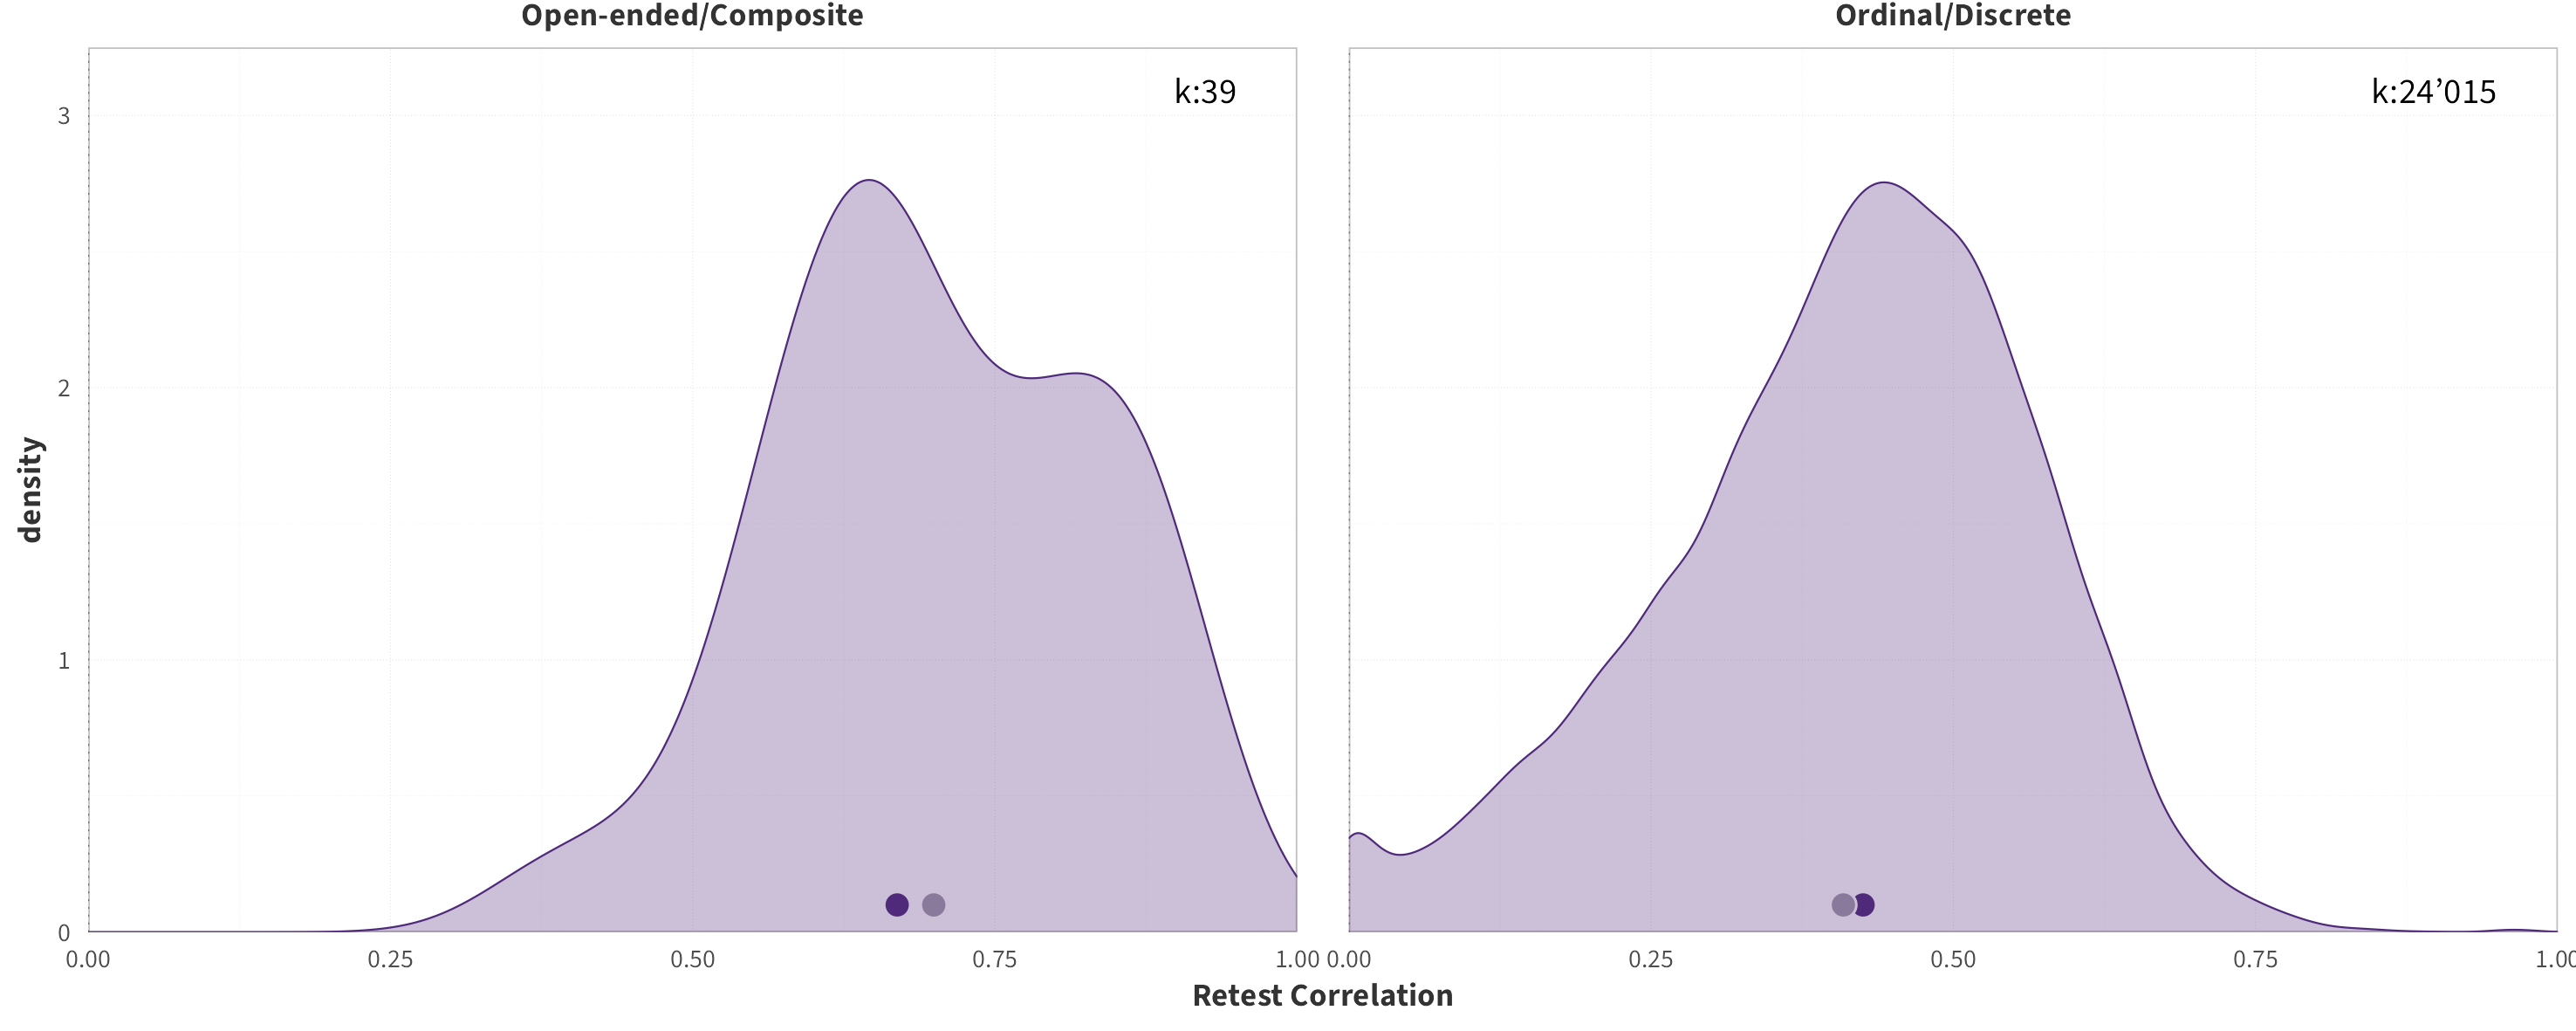
By Age
By Gender
By Panel
By Sample Size
By Retest Interval
Frequency
By Domain
By Scale Type
By Age
By Gender
By Panel
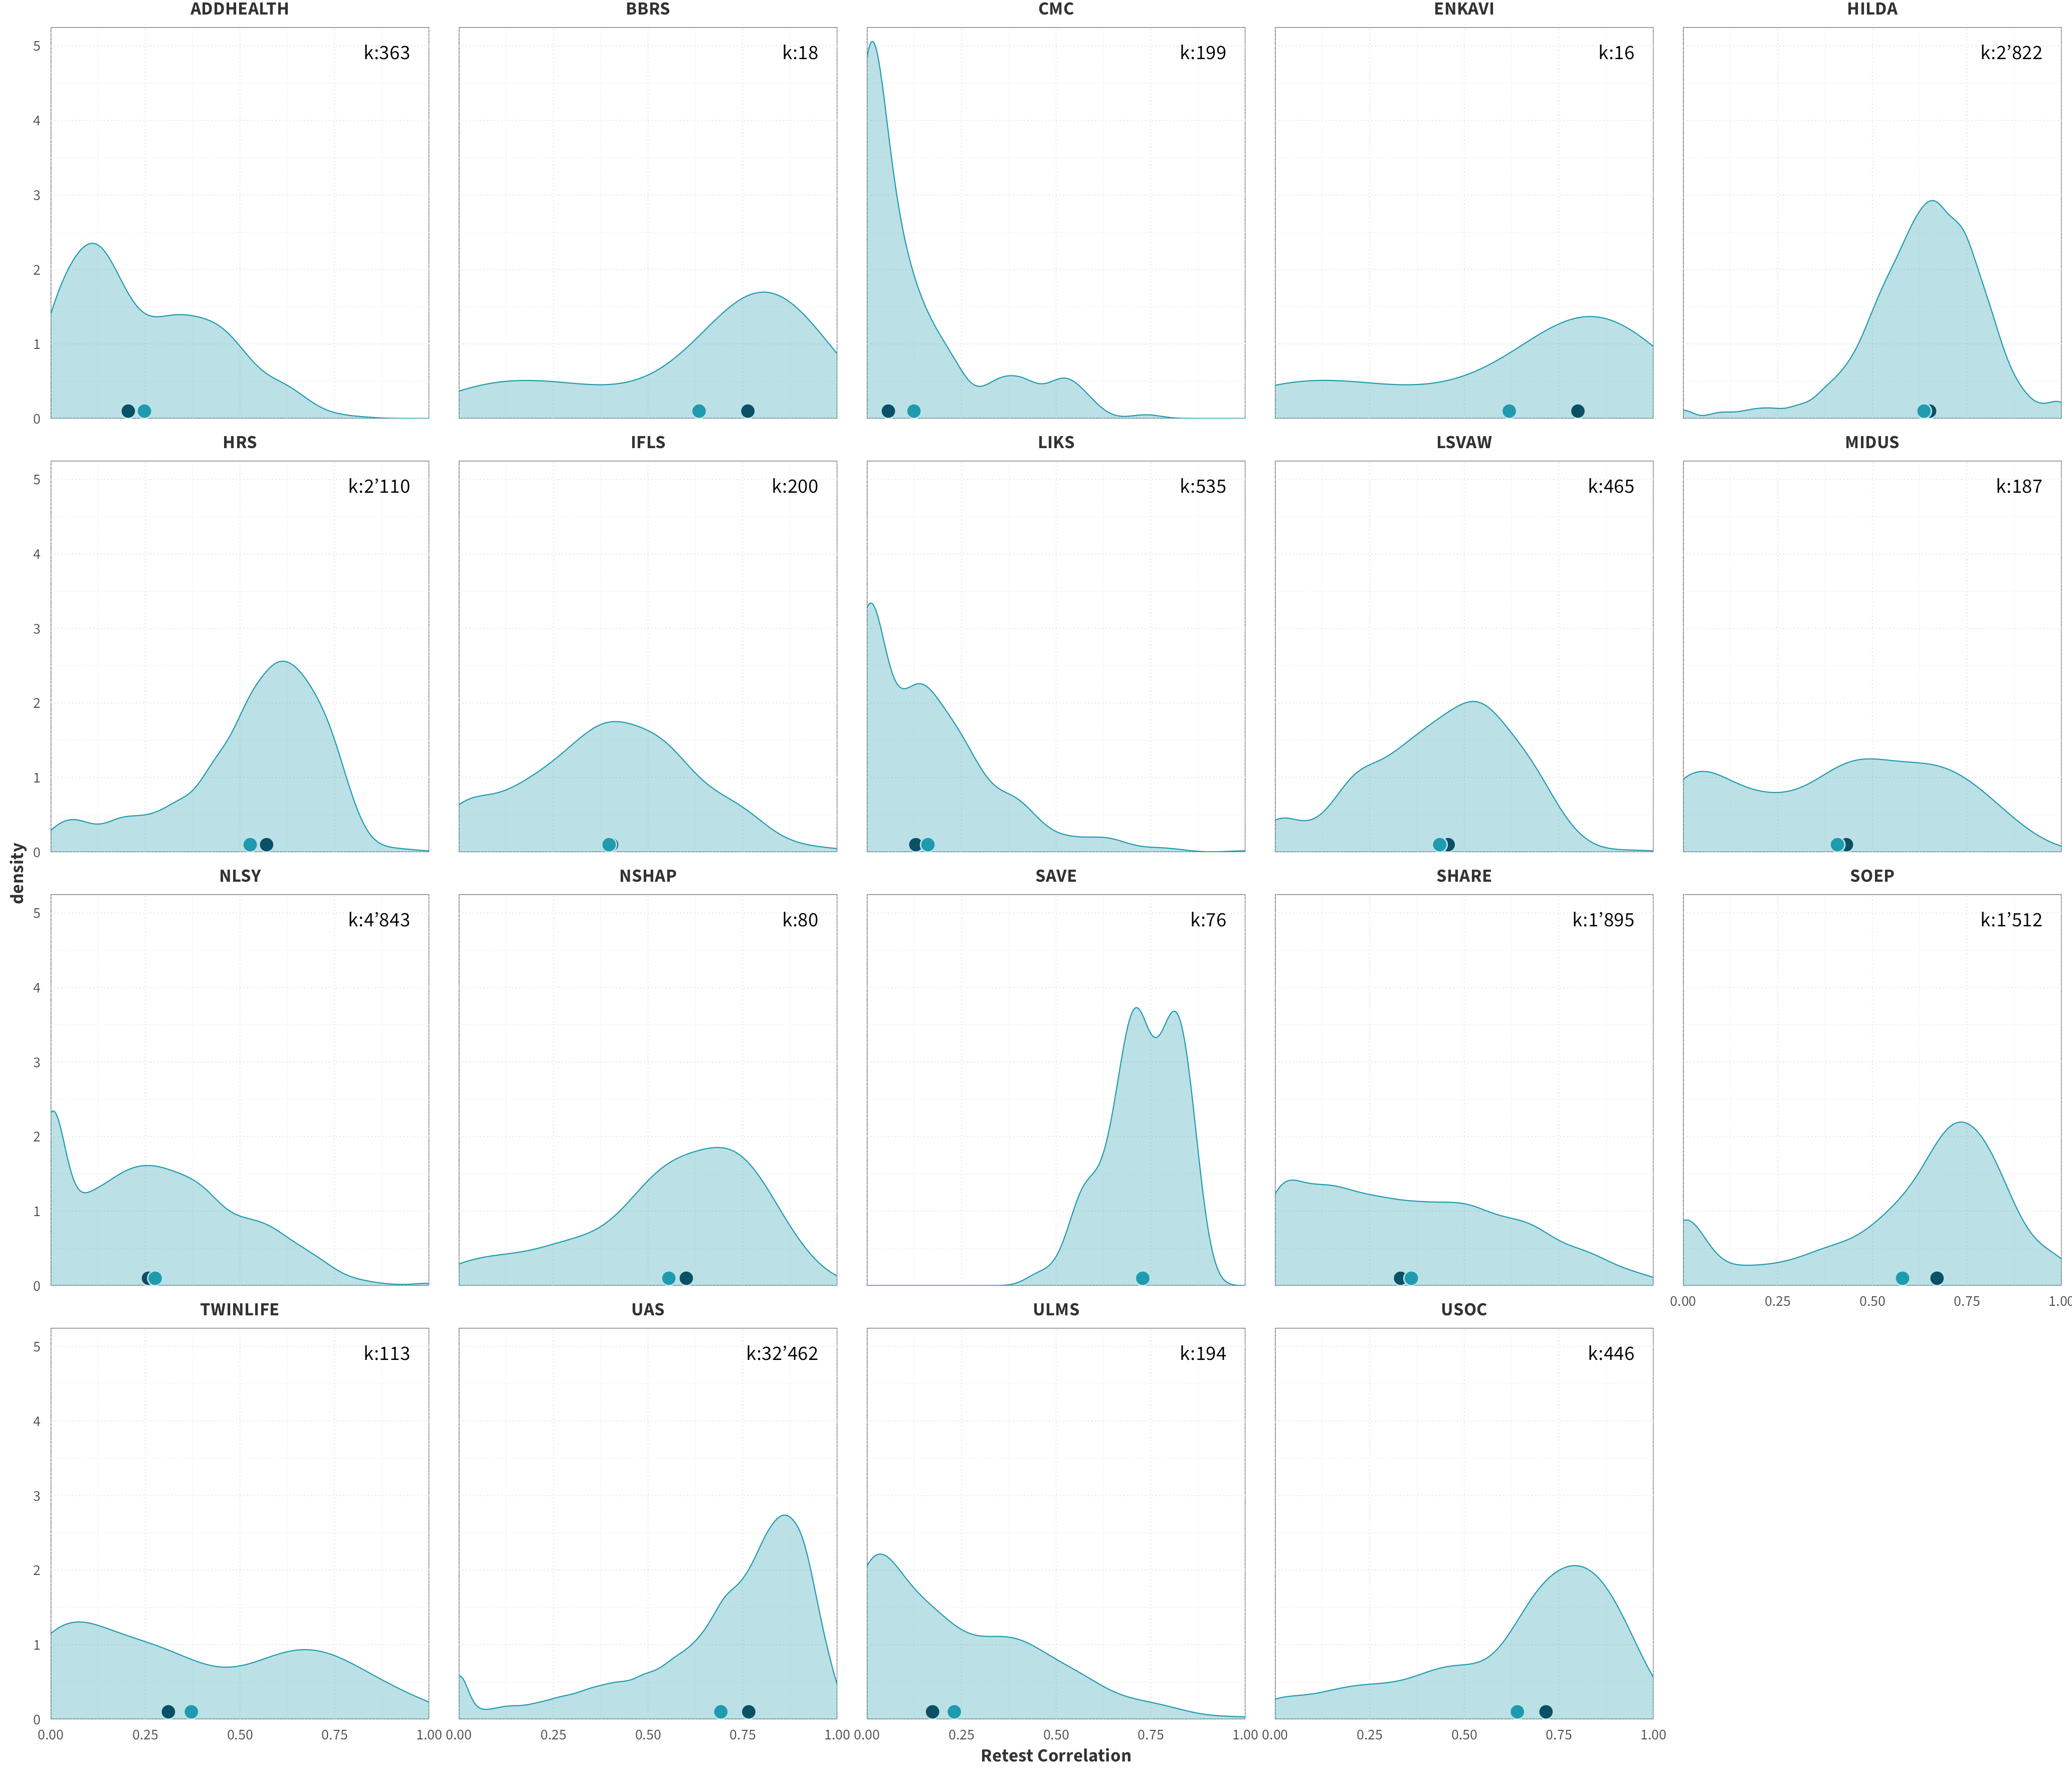
By Sample Size
By Retest Interval
Behaviour
By Domain
By Scale Type
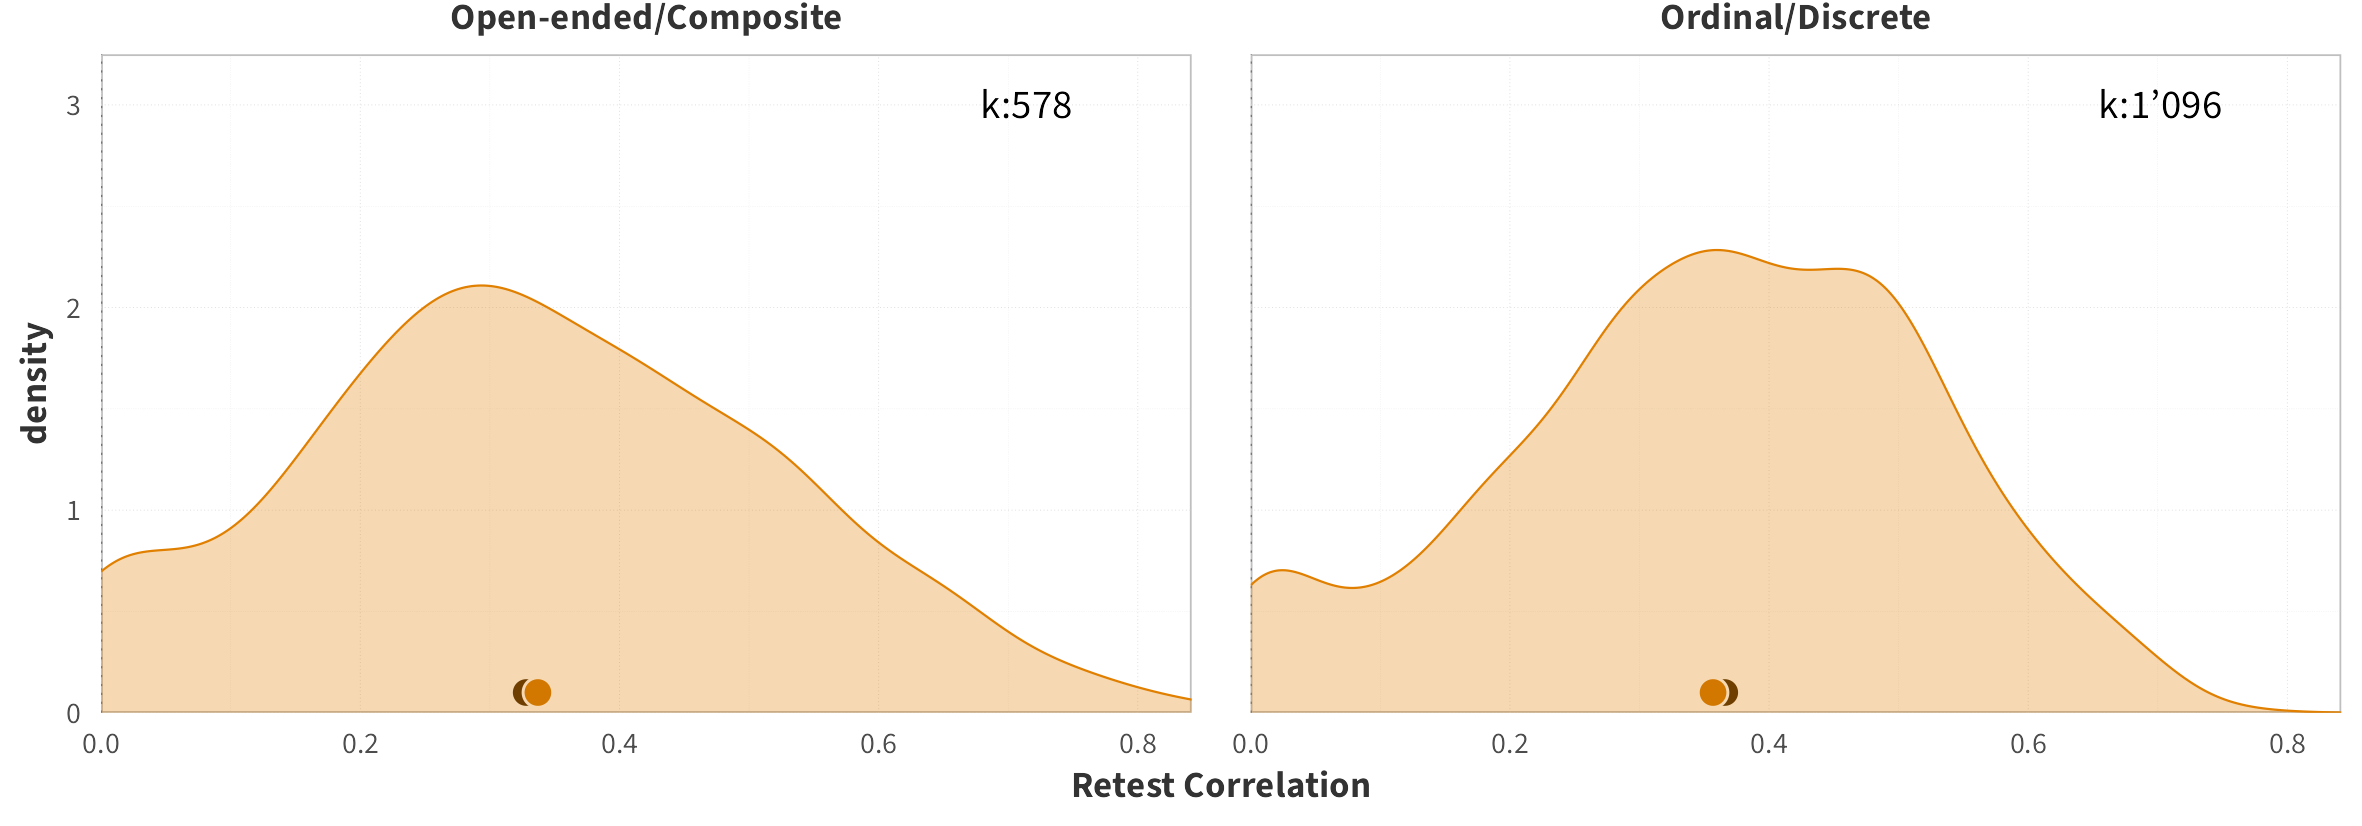
By Age
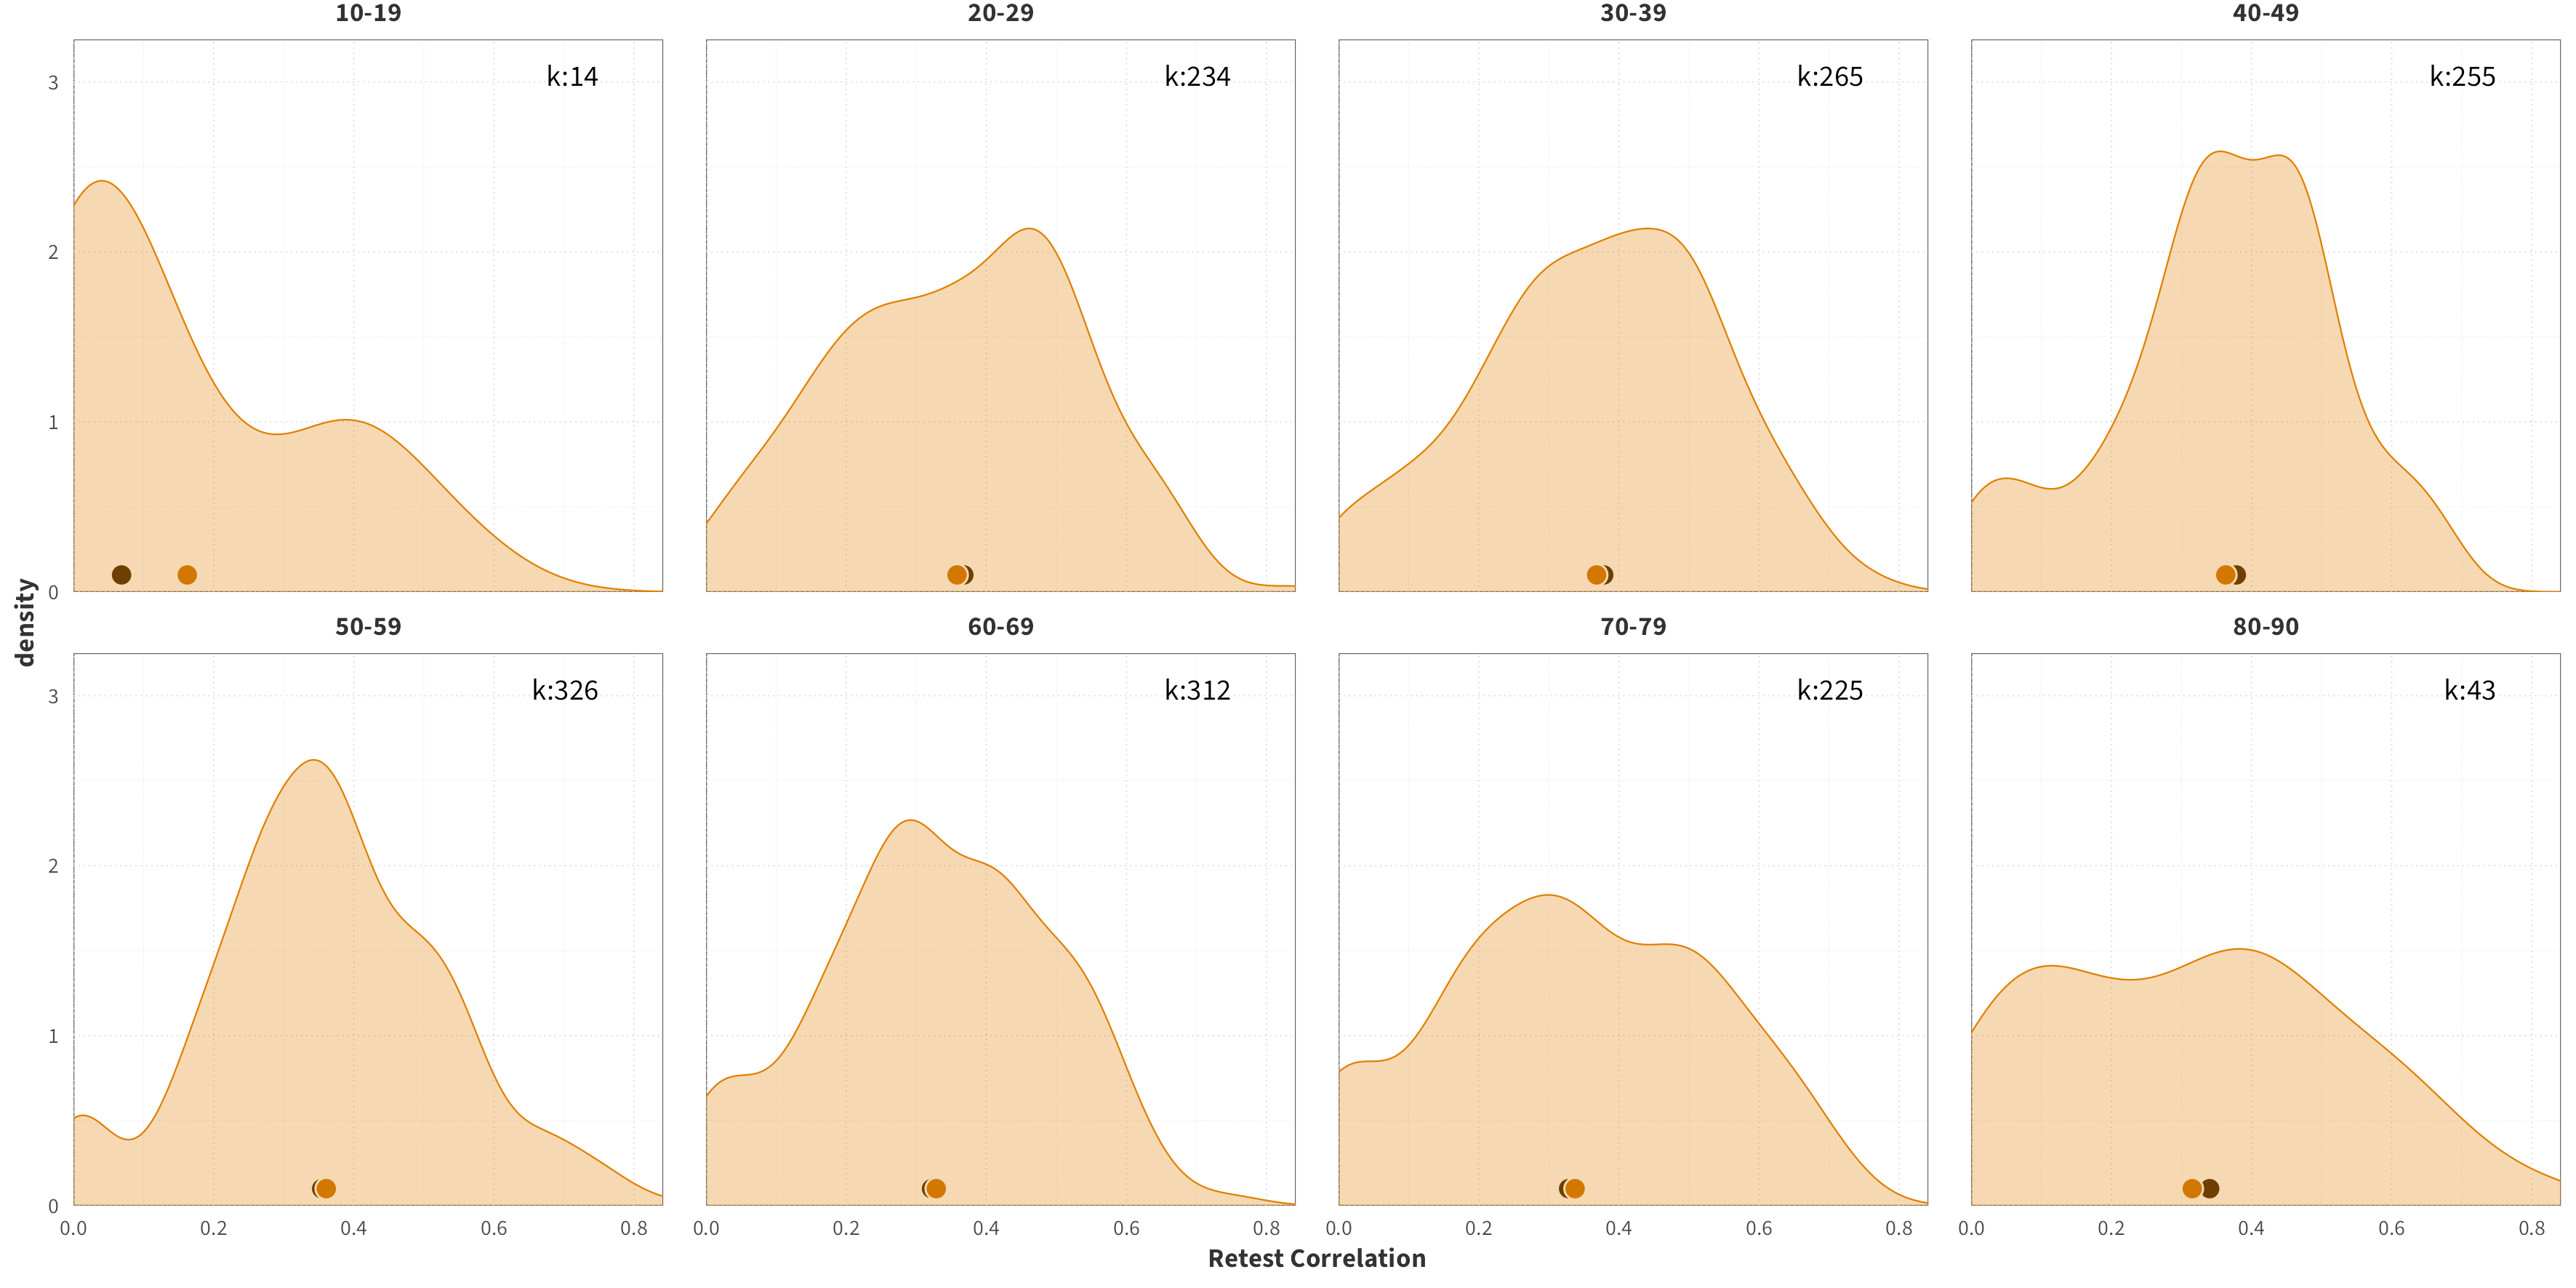
By Gender
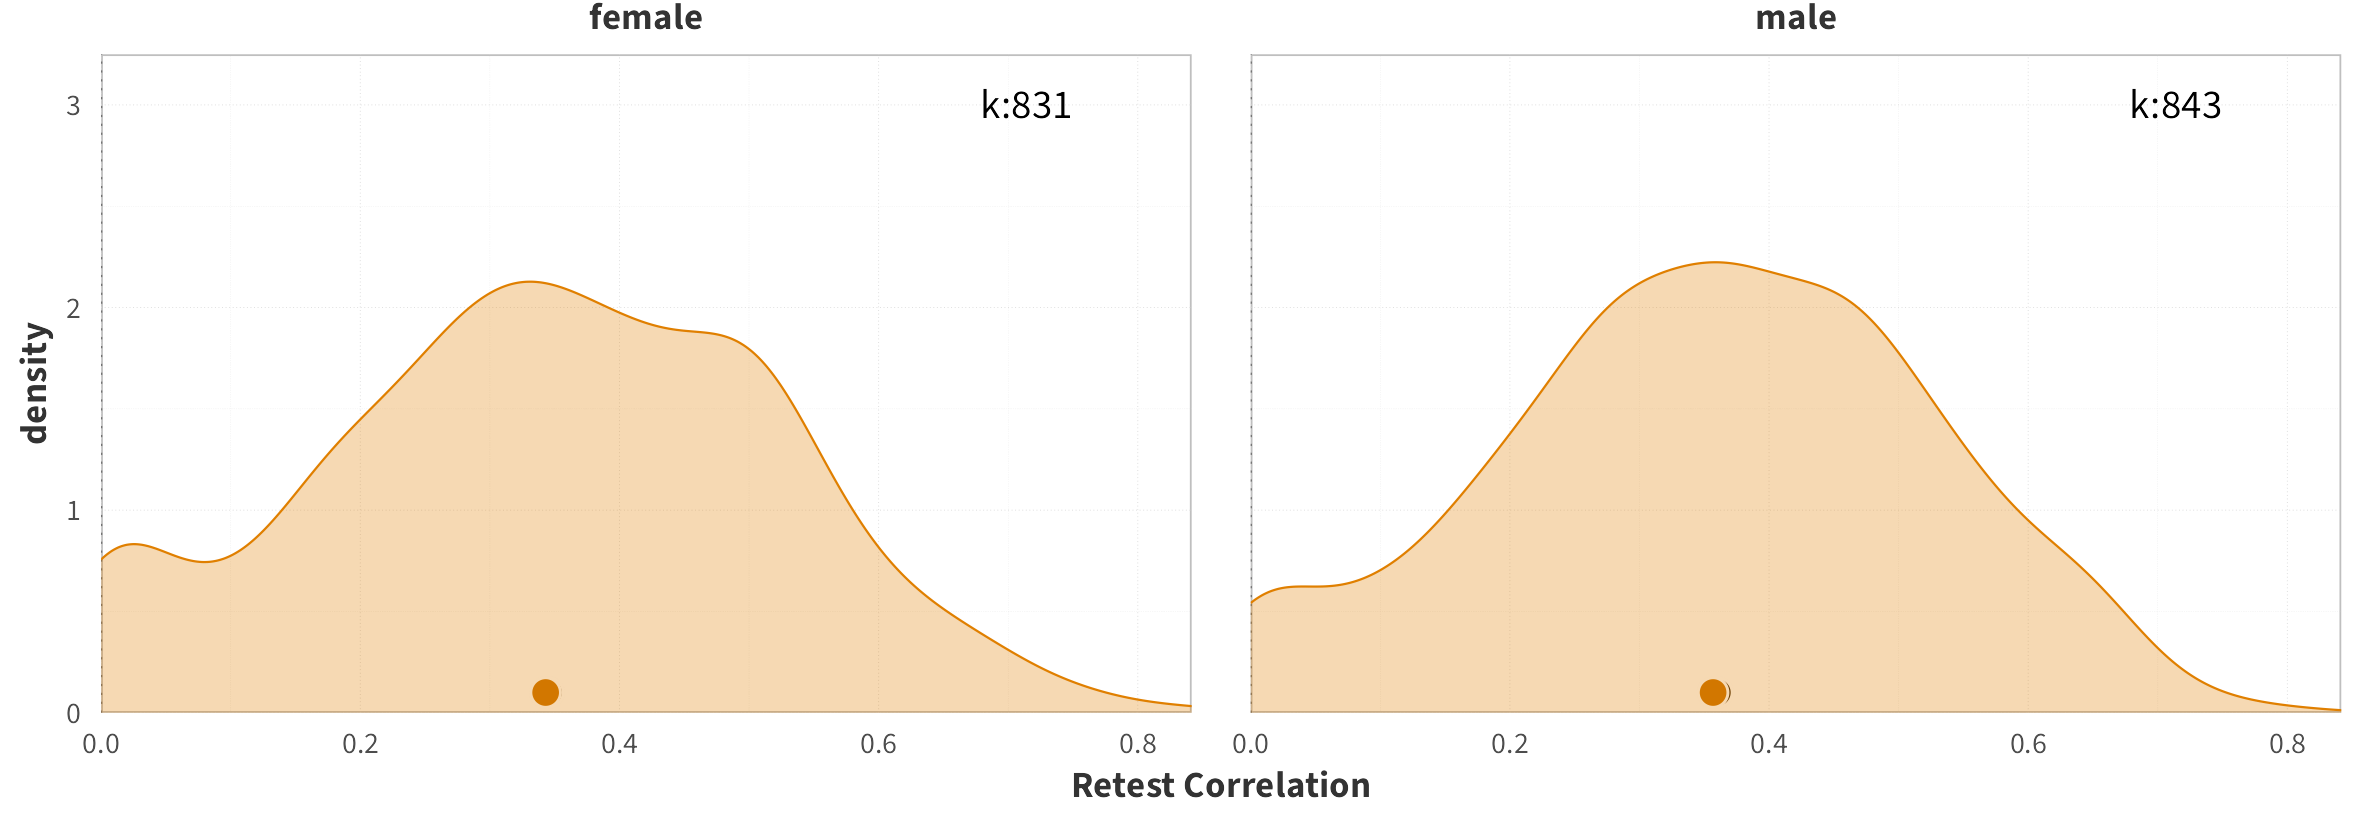
By Panel
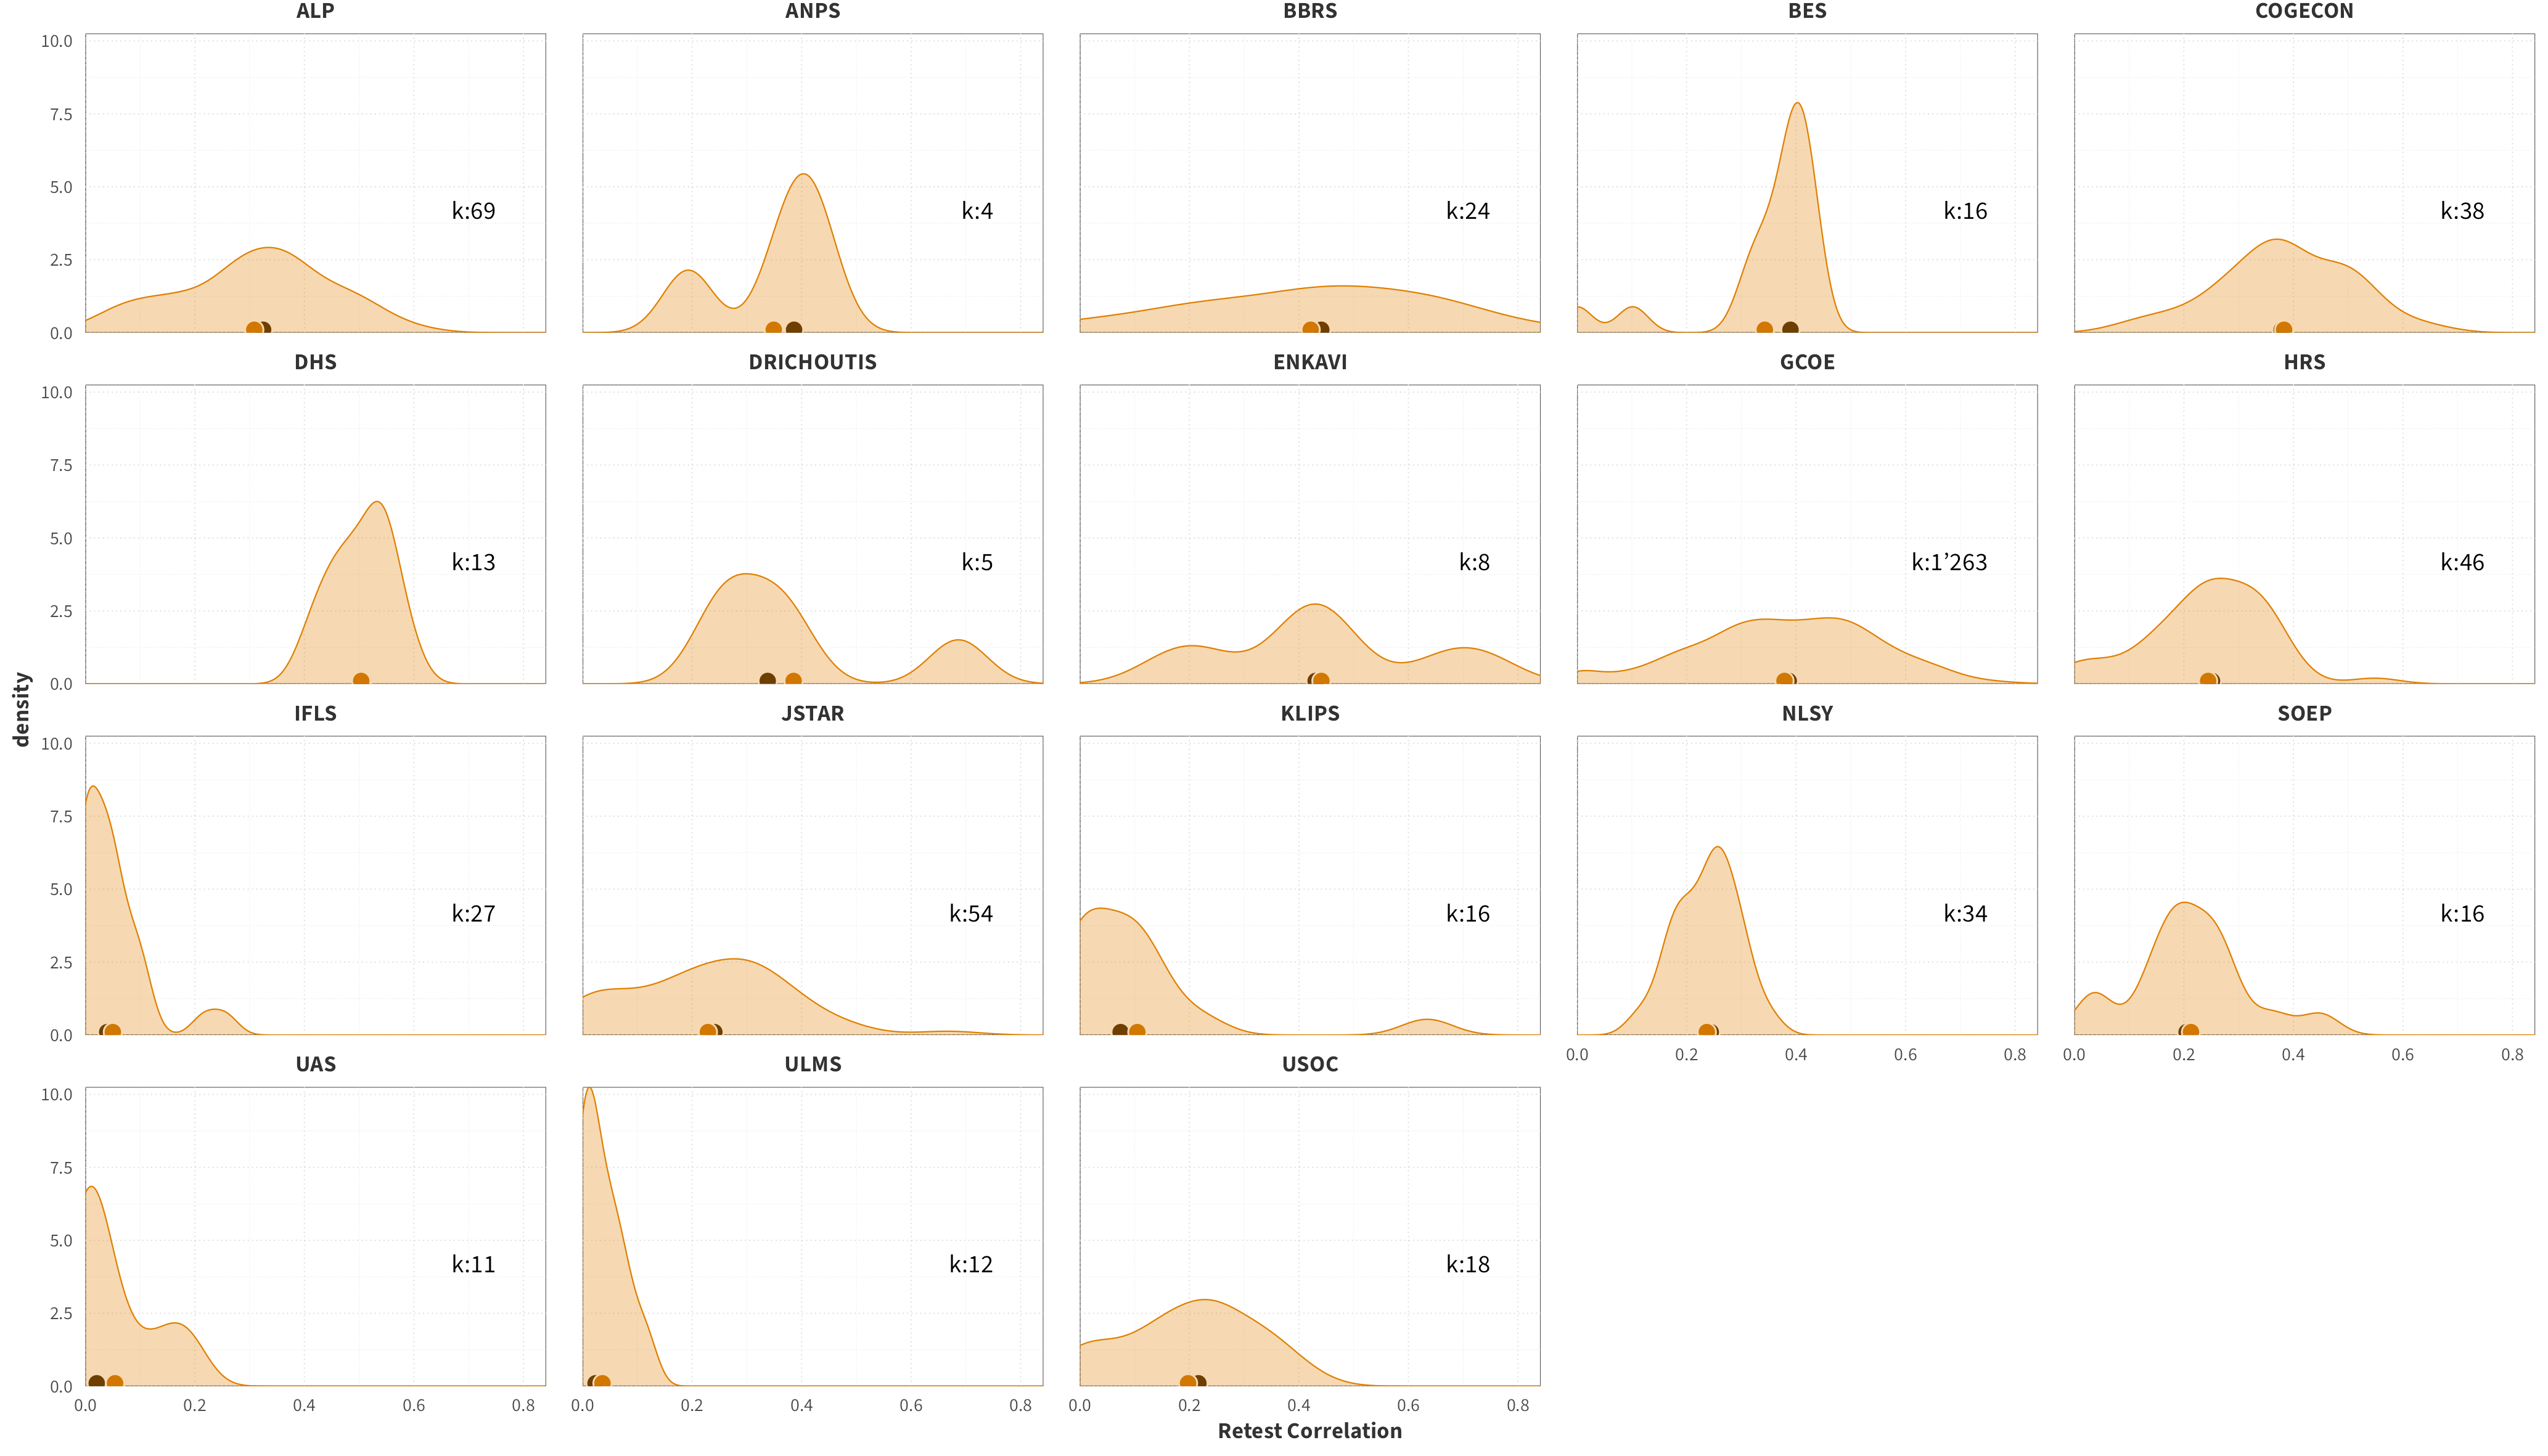
By Sample Size
By Retest Interval
Inter-Correlations
By Matching Domain
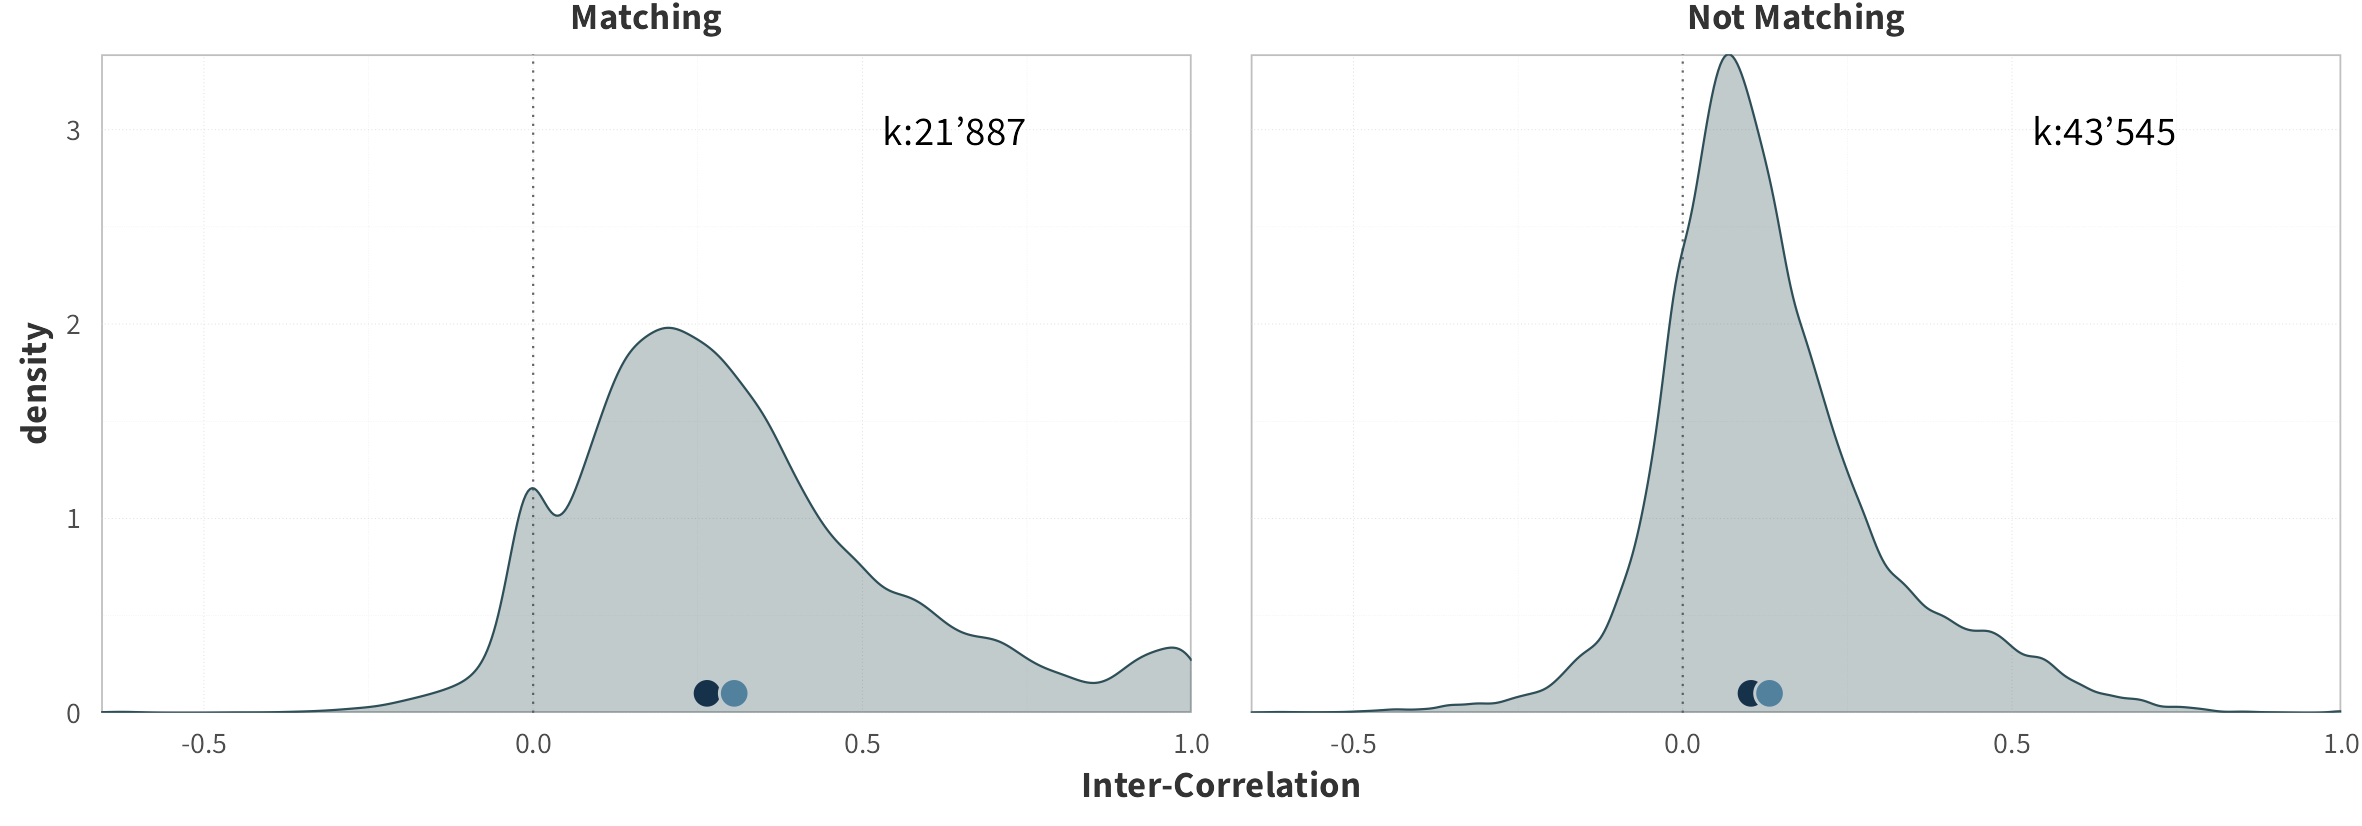
By Matching Scale Type
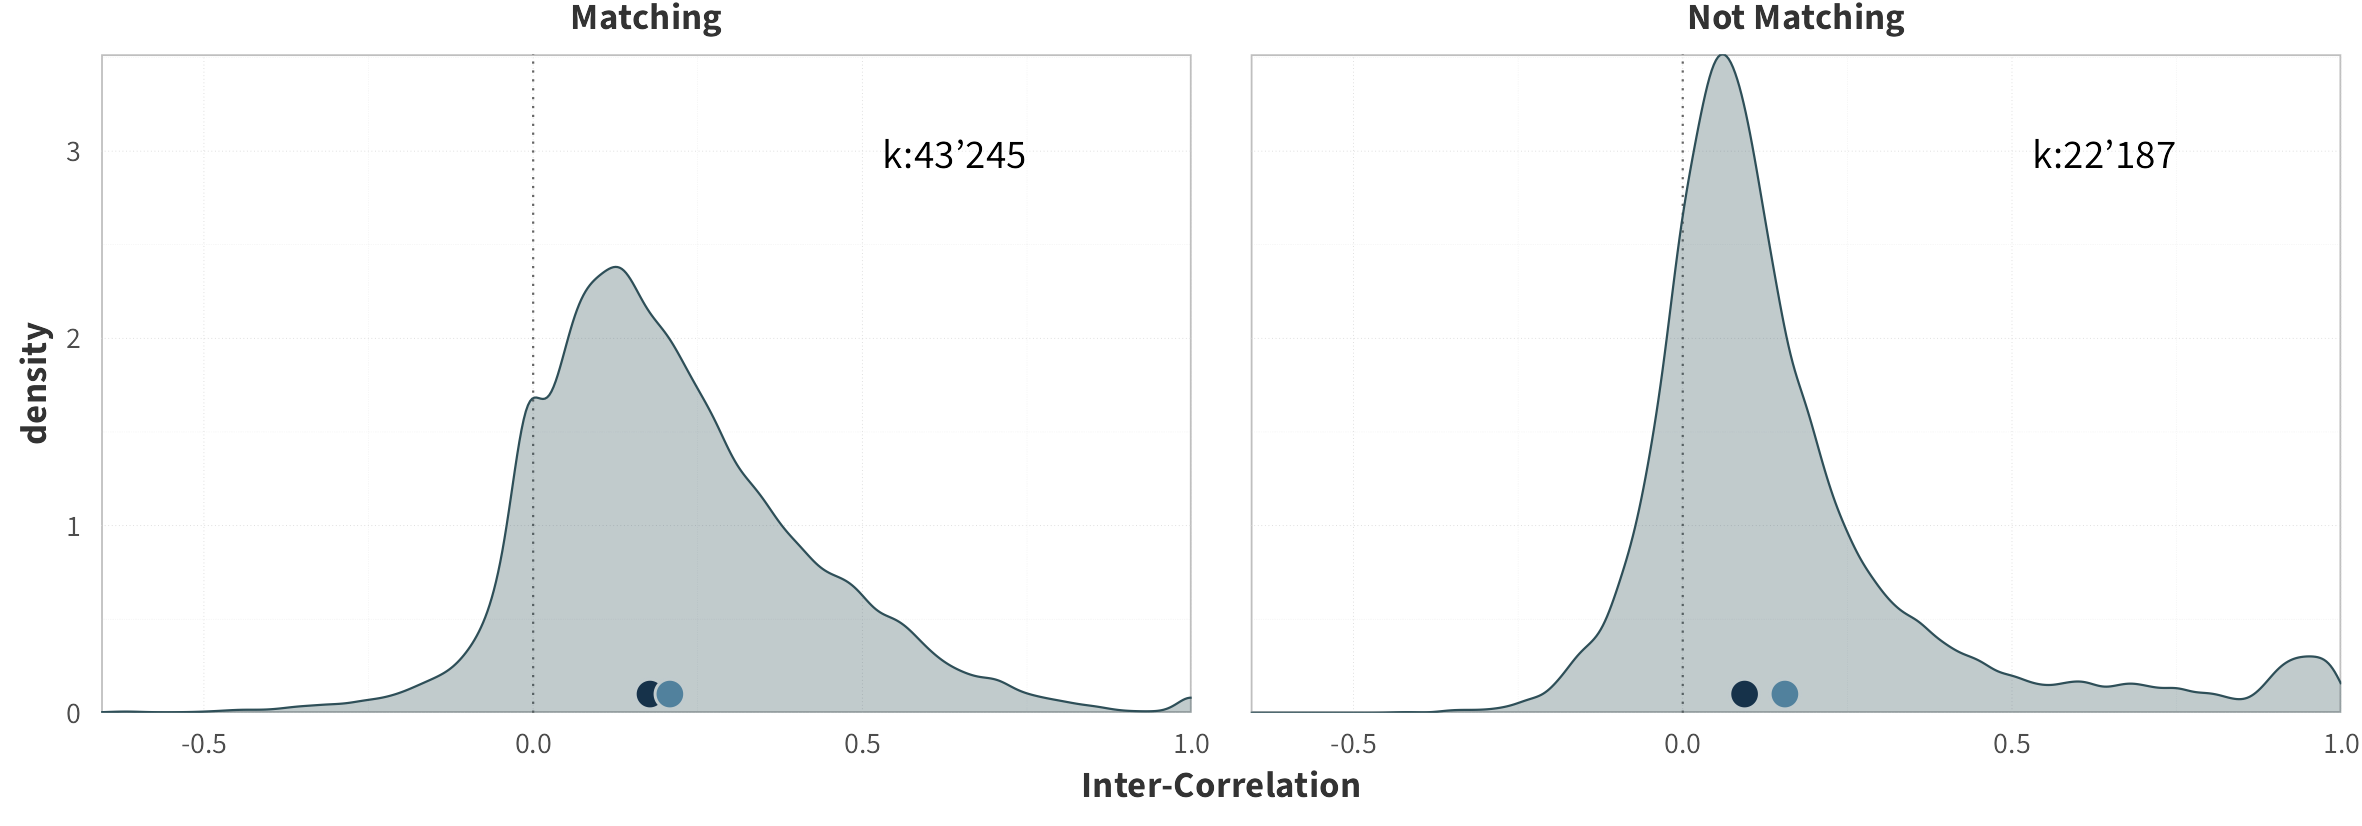
By Matching Category
By Age
By Gender
By Panel
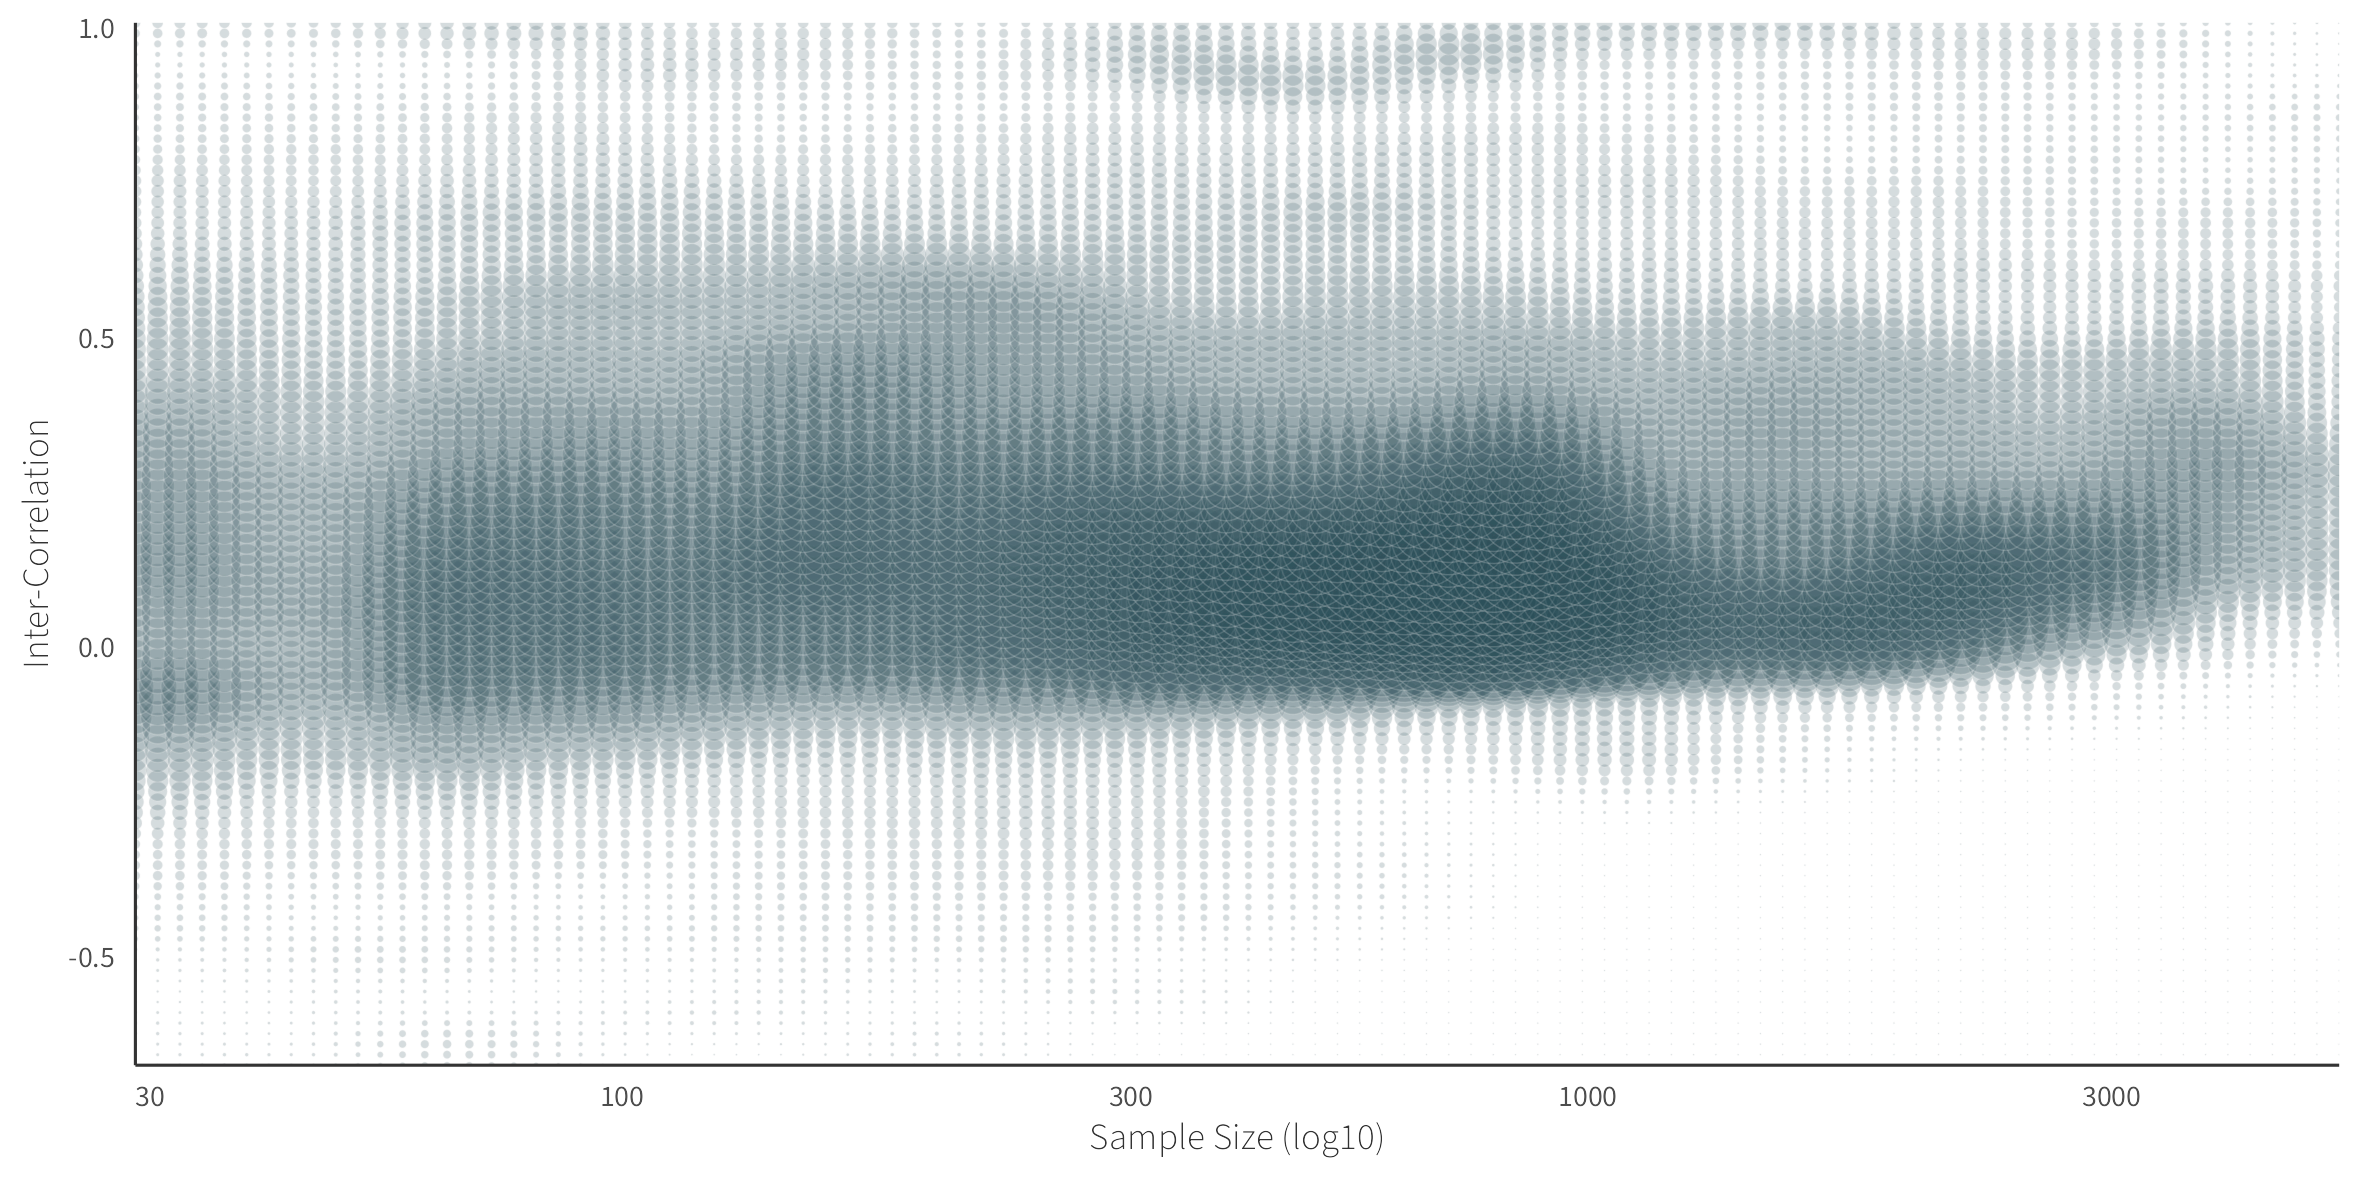
By Sample Size
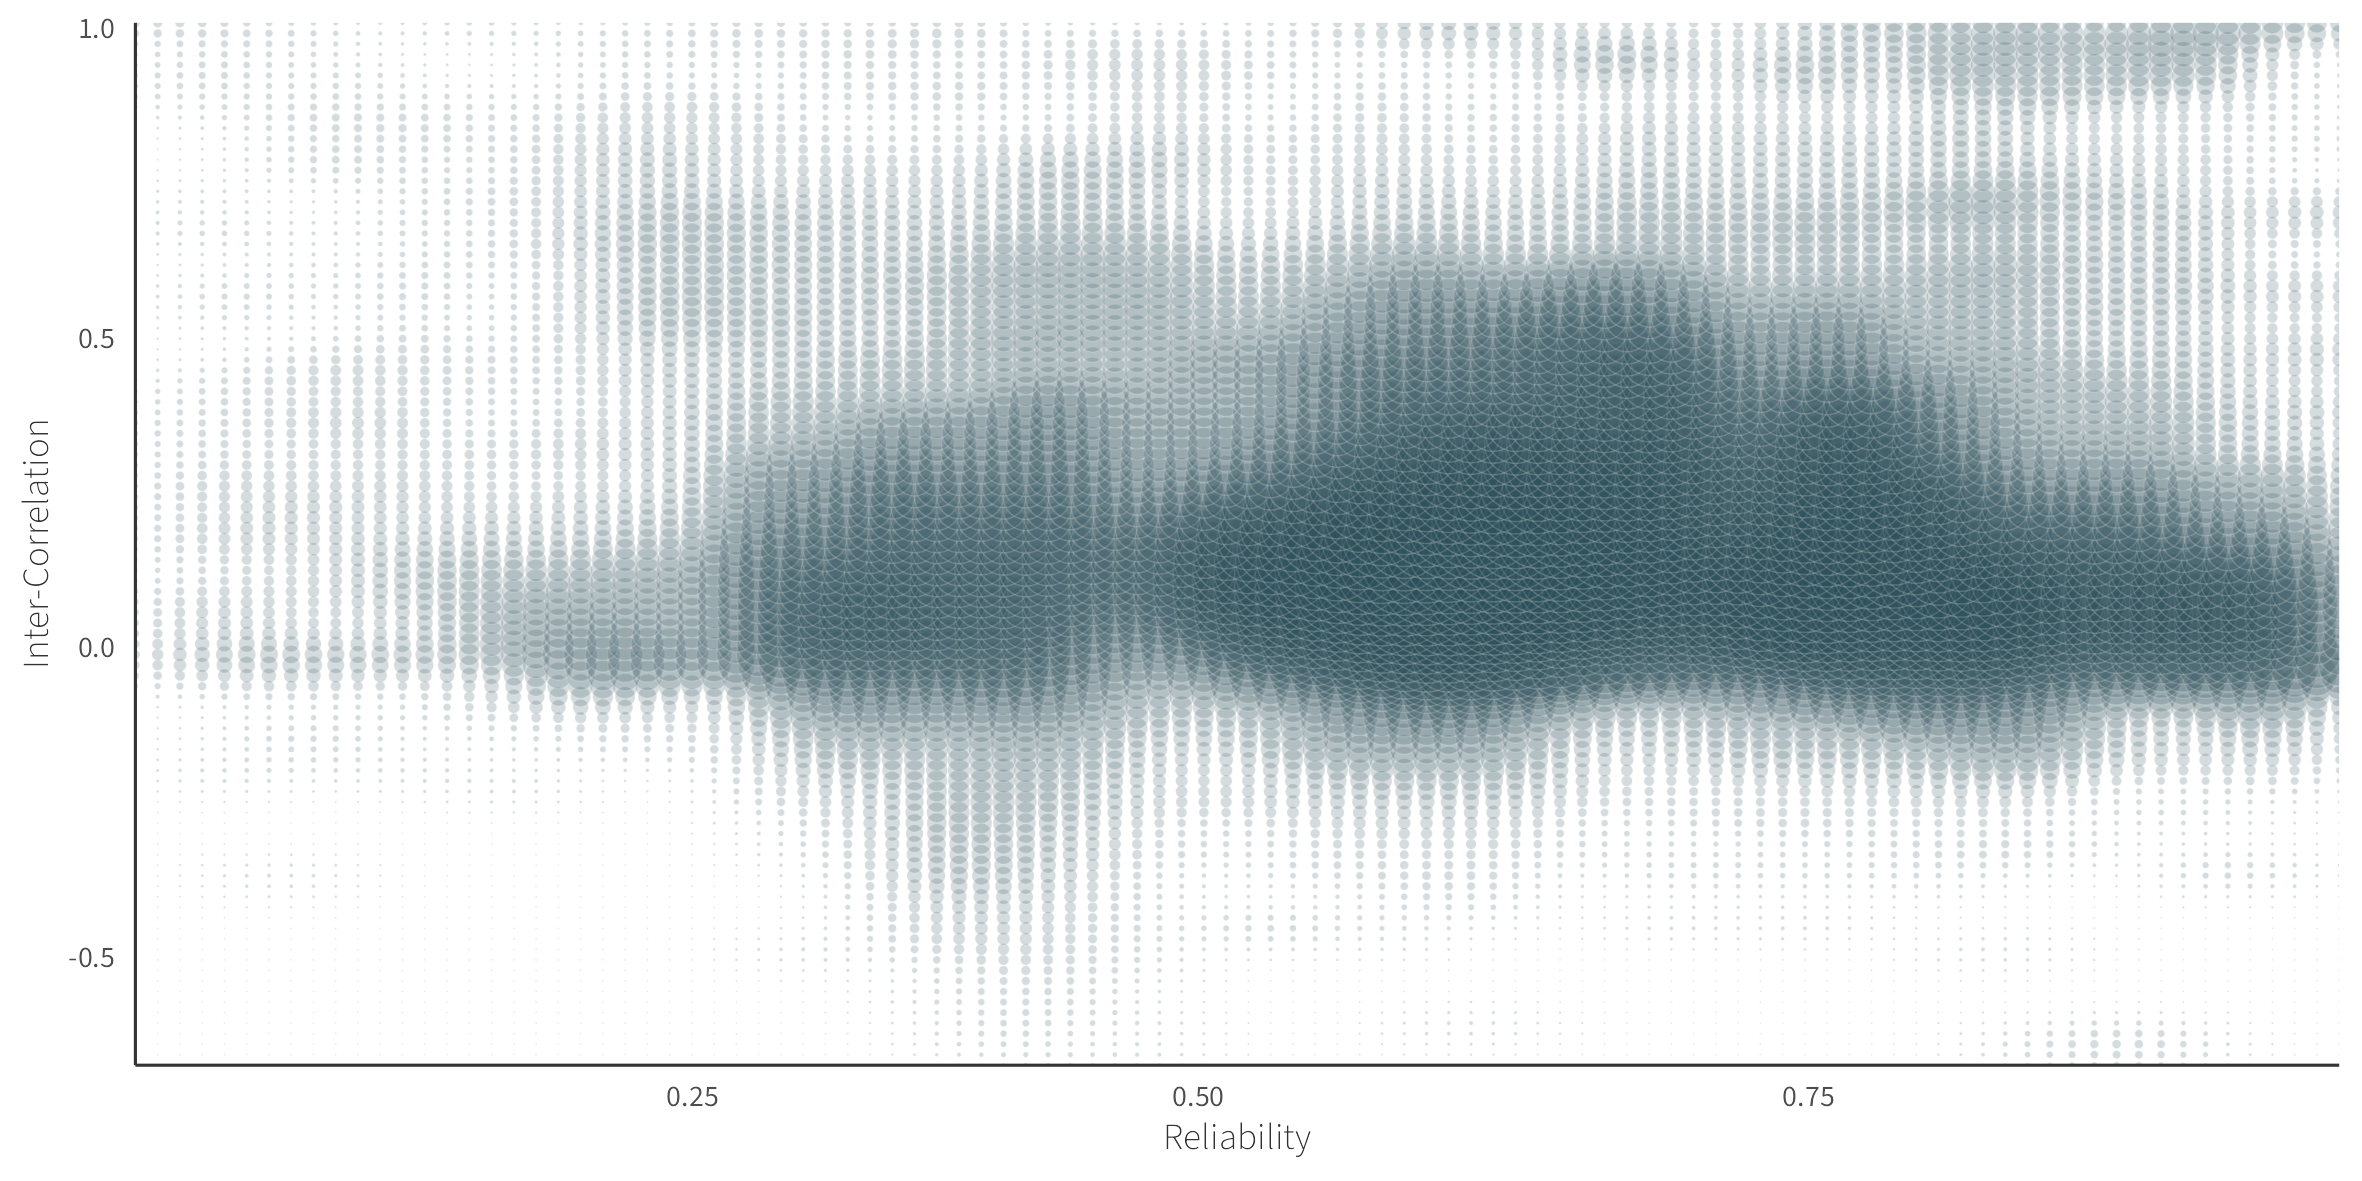
By Reliability
Additional Analysis including Item Match Type
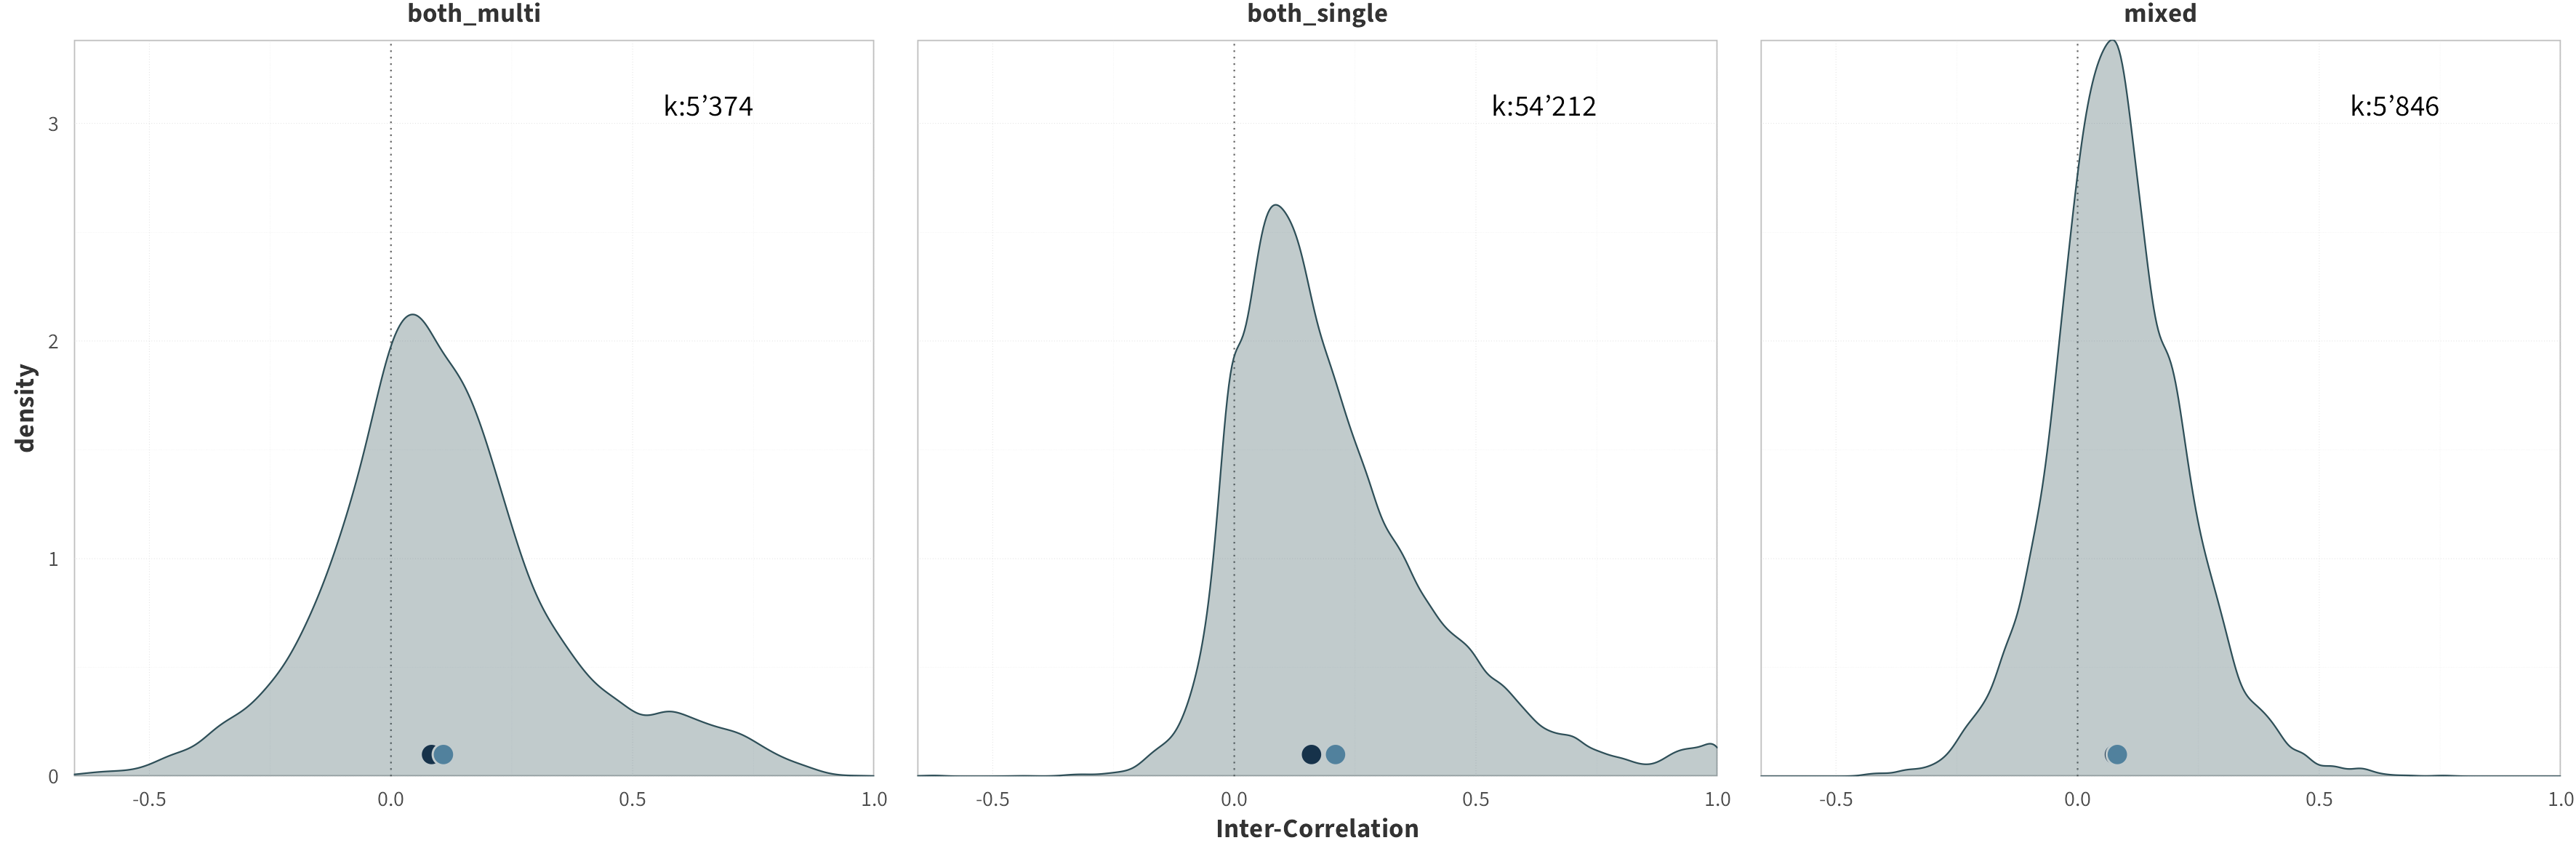
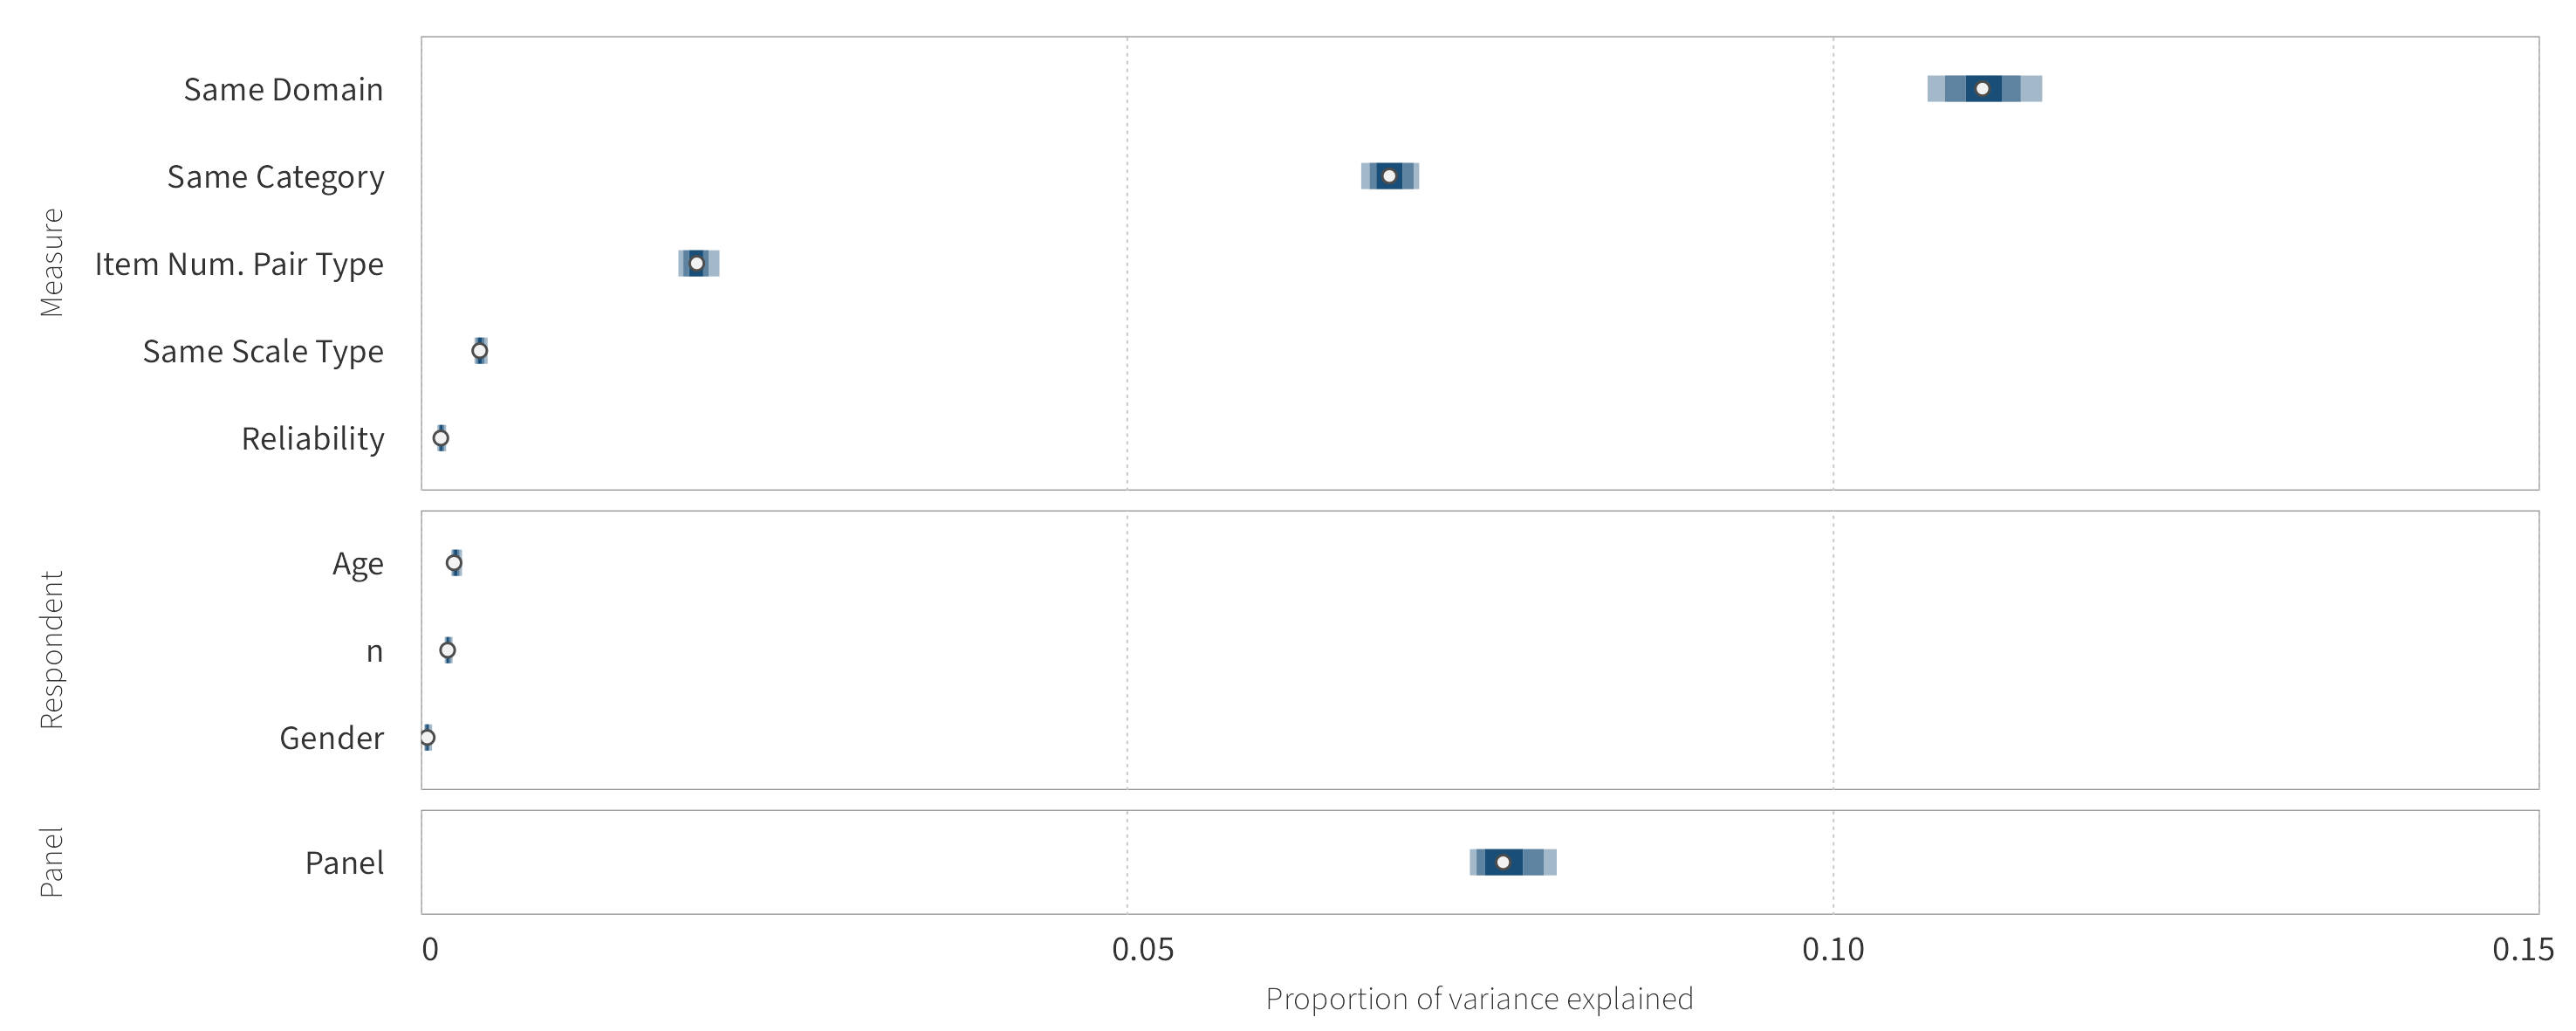
We conducted an additional Variance Decomposition analysis including “Item Number Pair Type” (i.e., “both single item measures”, “both multi item measures”, “mixed”) as a predictor. Below are the distributions of intercorrelations for each level of “Item Number Pair Type” and the results of the analyses. Overall, the 9 predictors explained 28.54% of the variance, and item number match explained 1.95%.
