Multiverse Analysis Overview
Brief Description
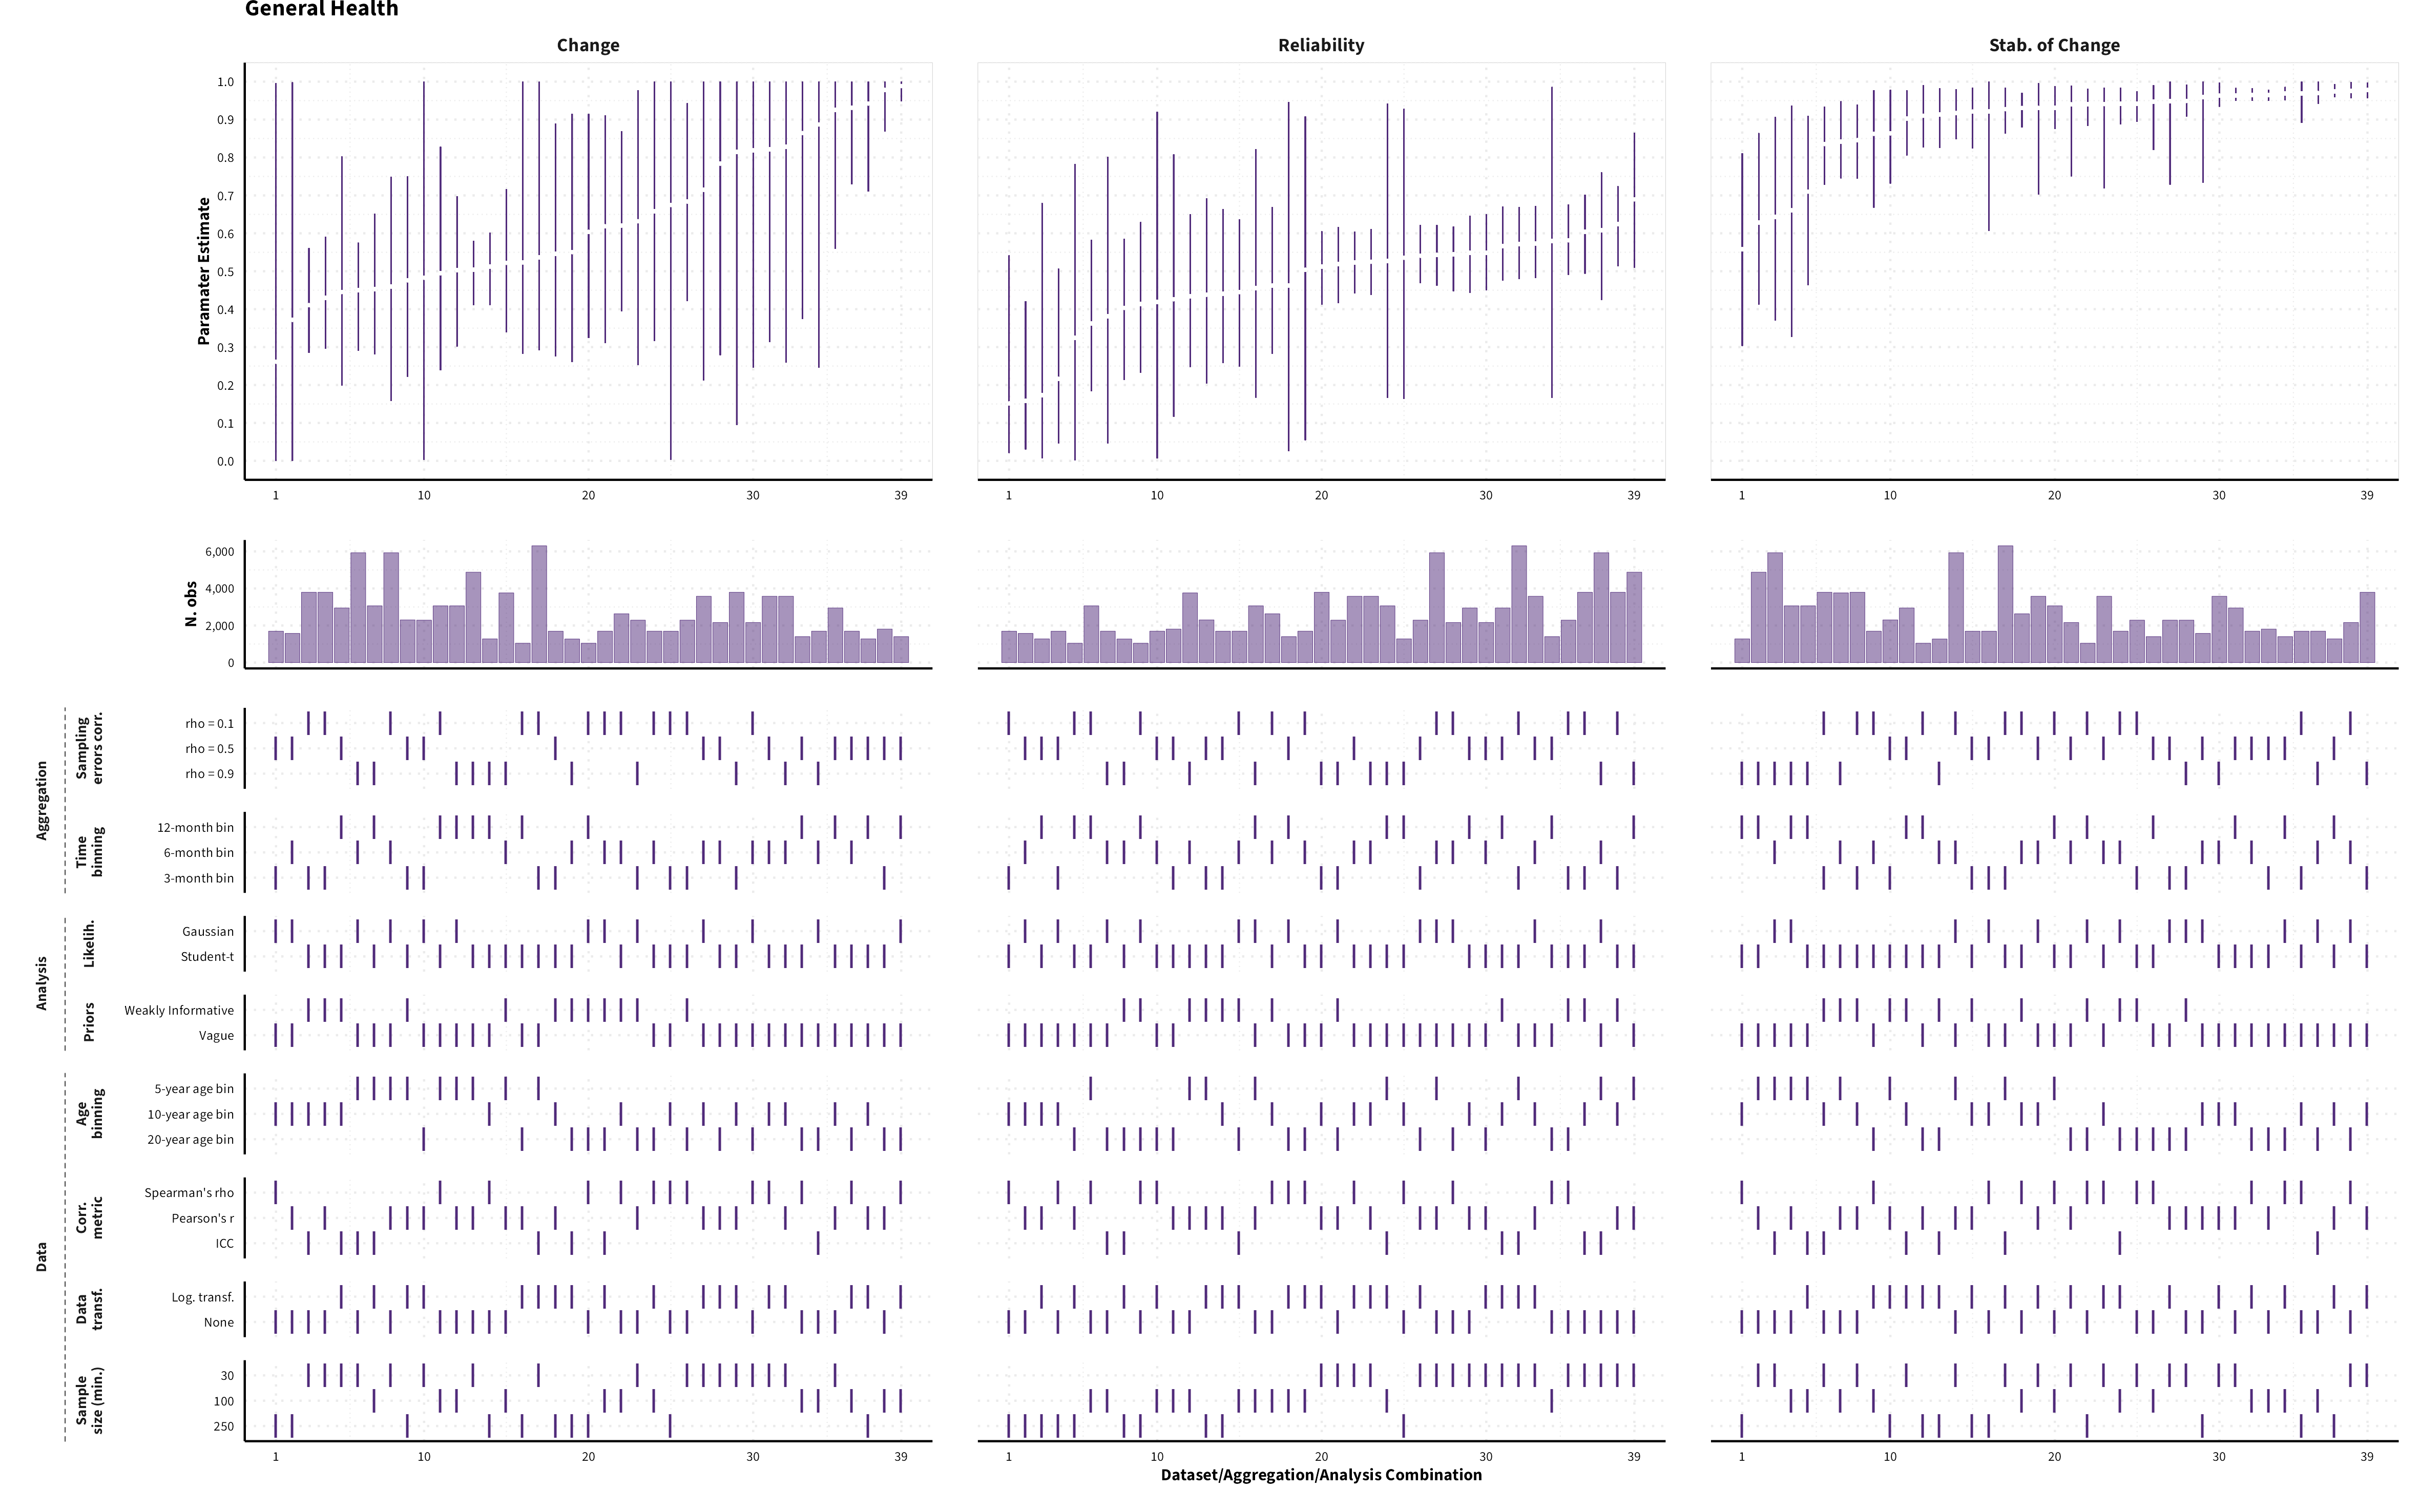
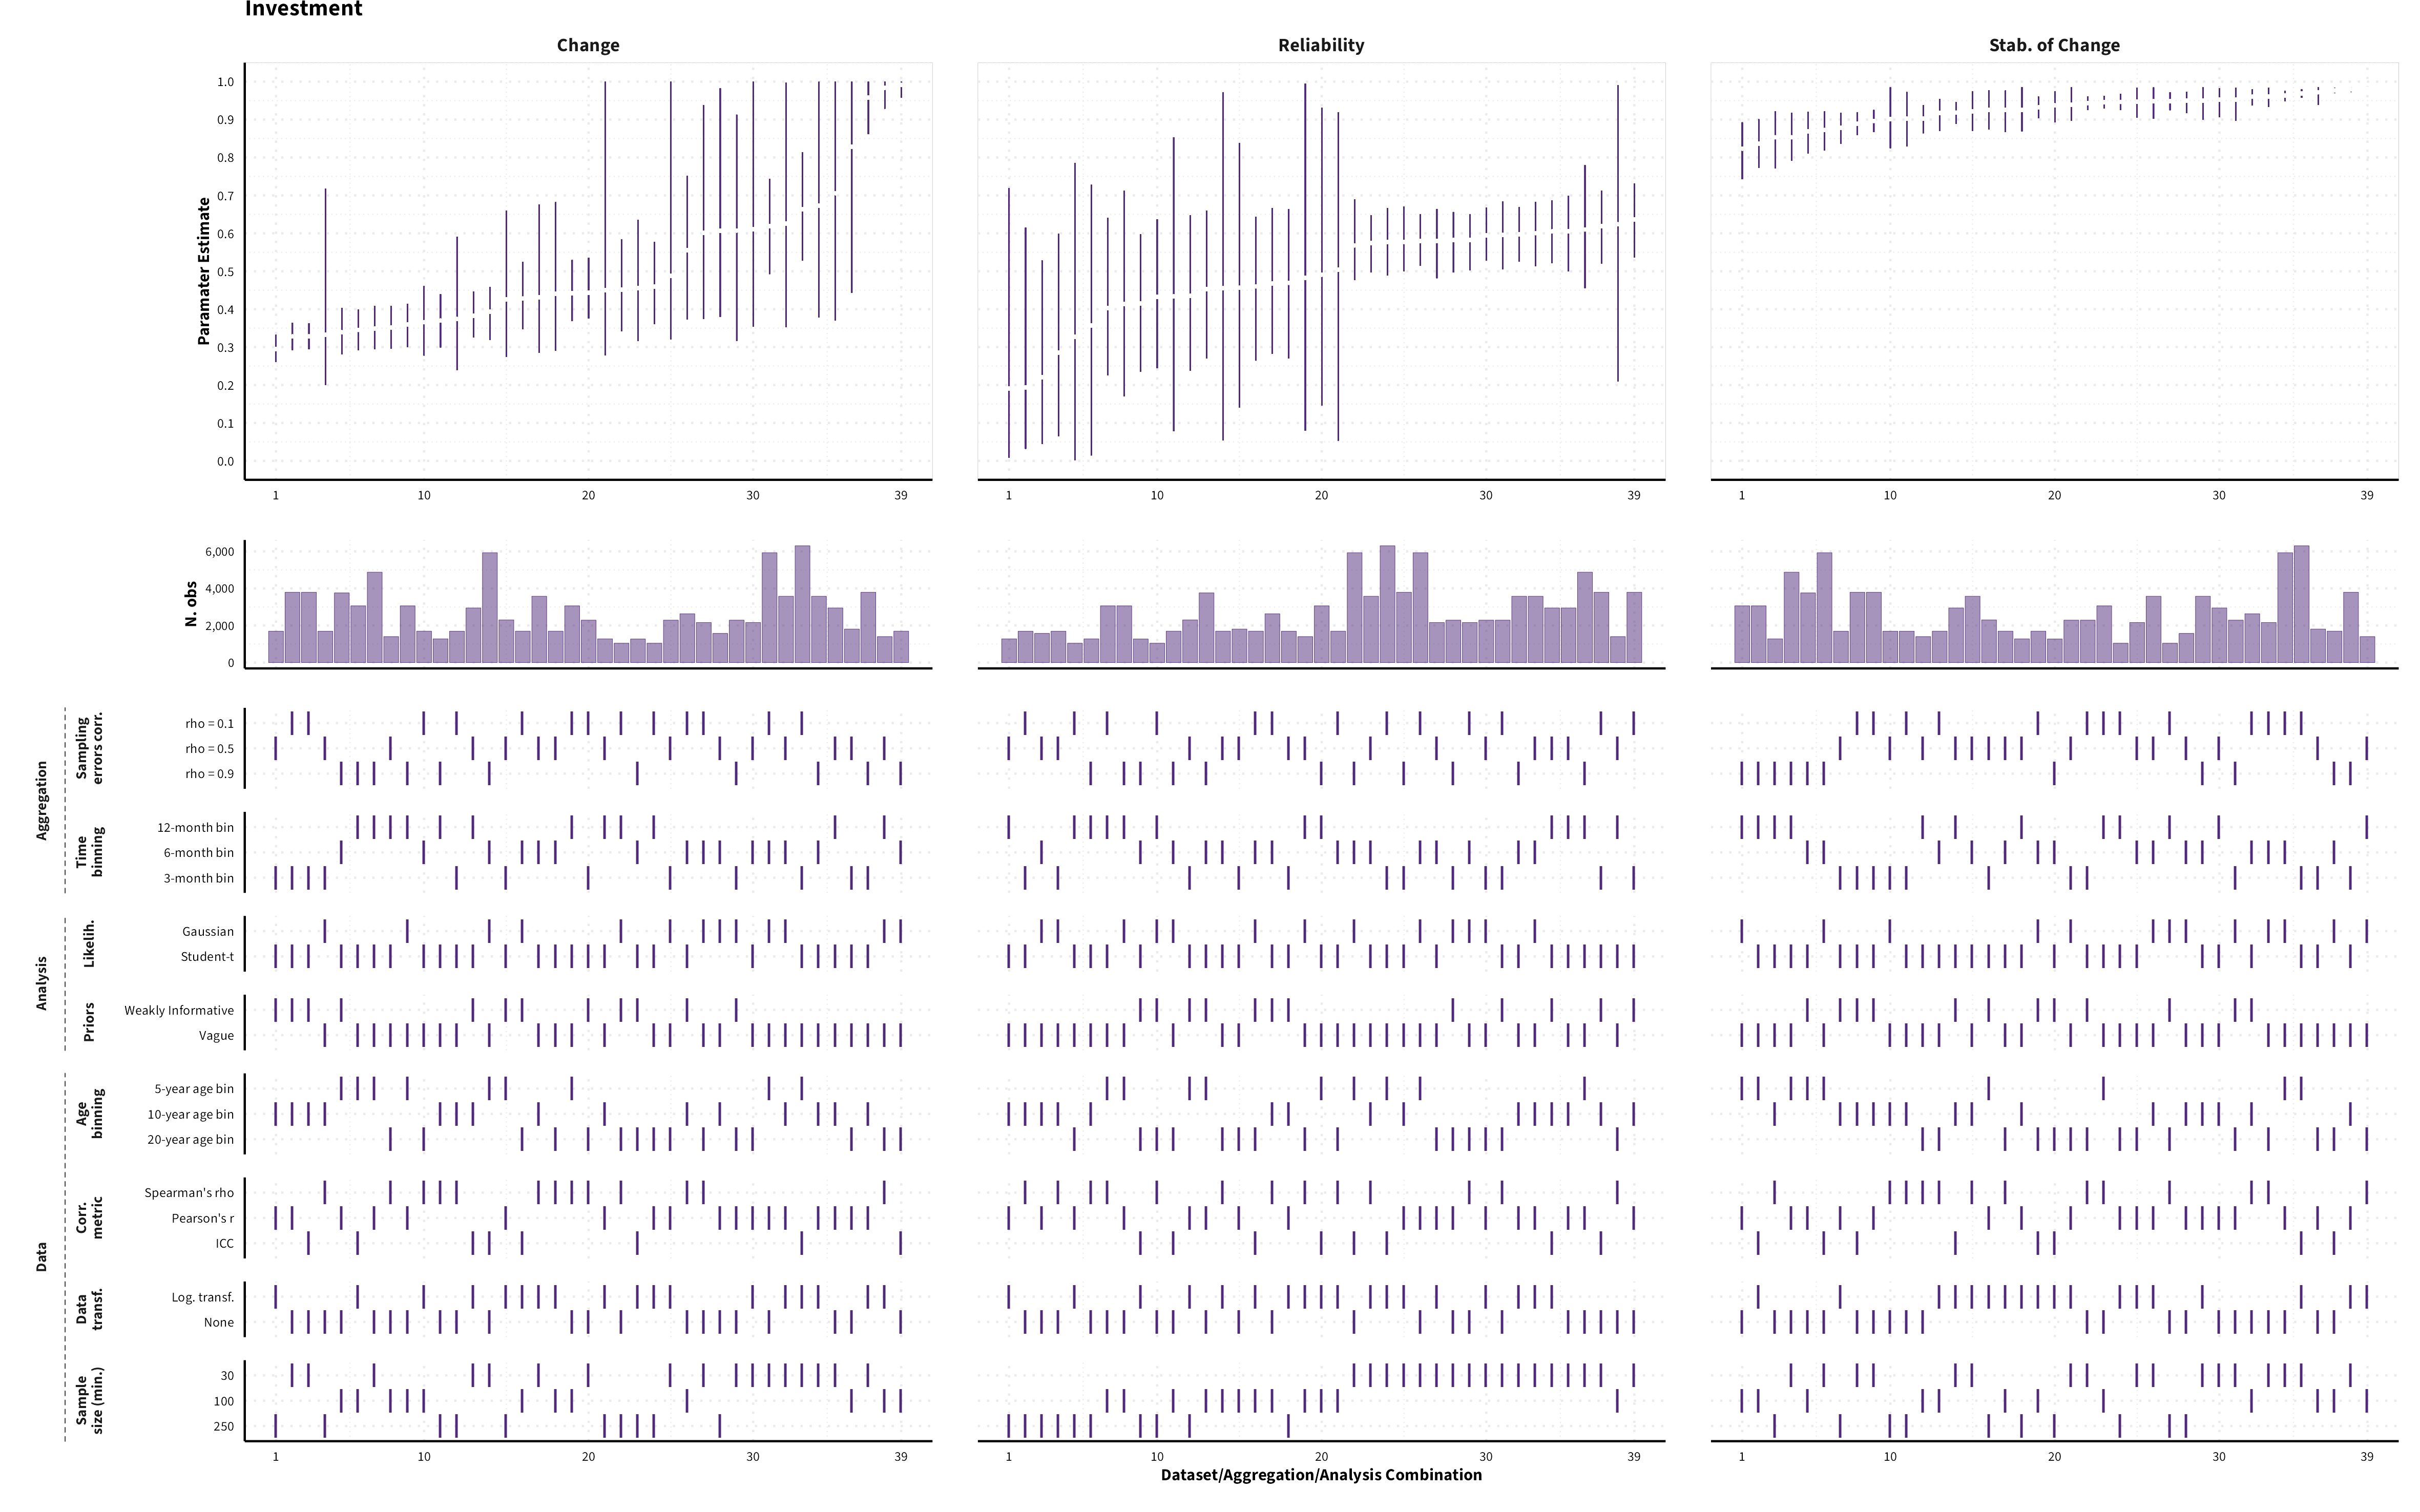
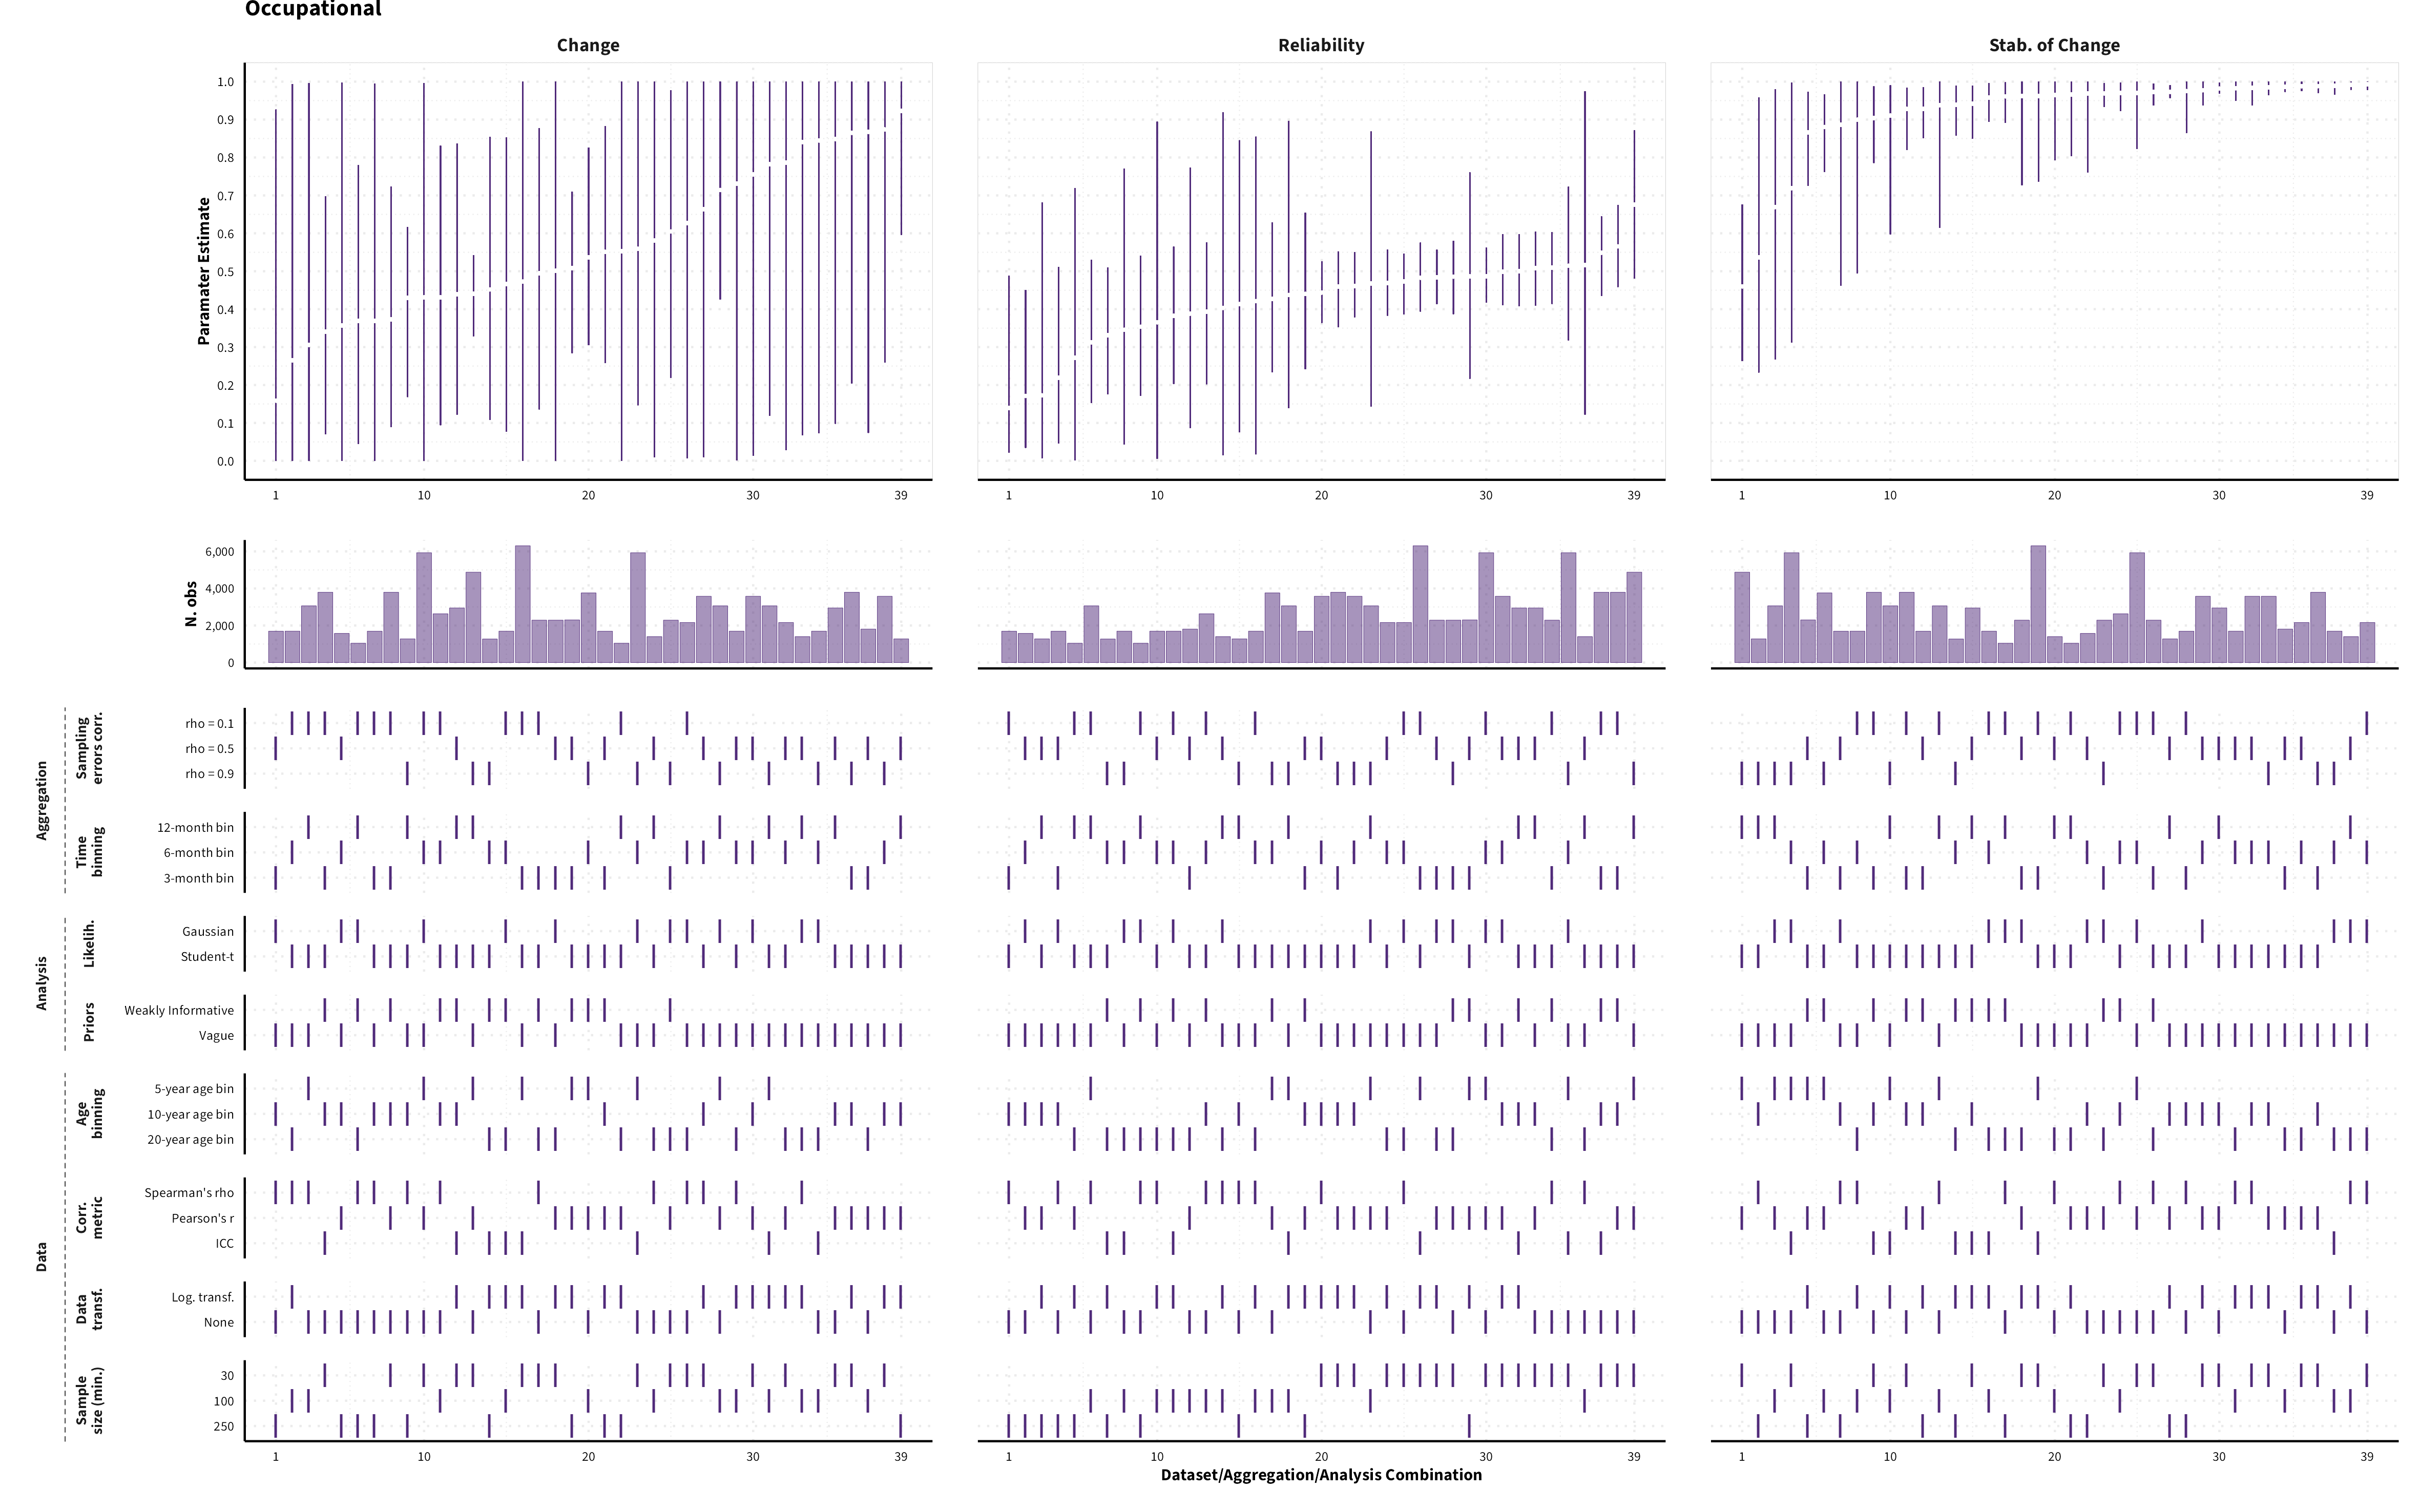
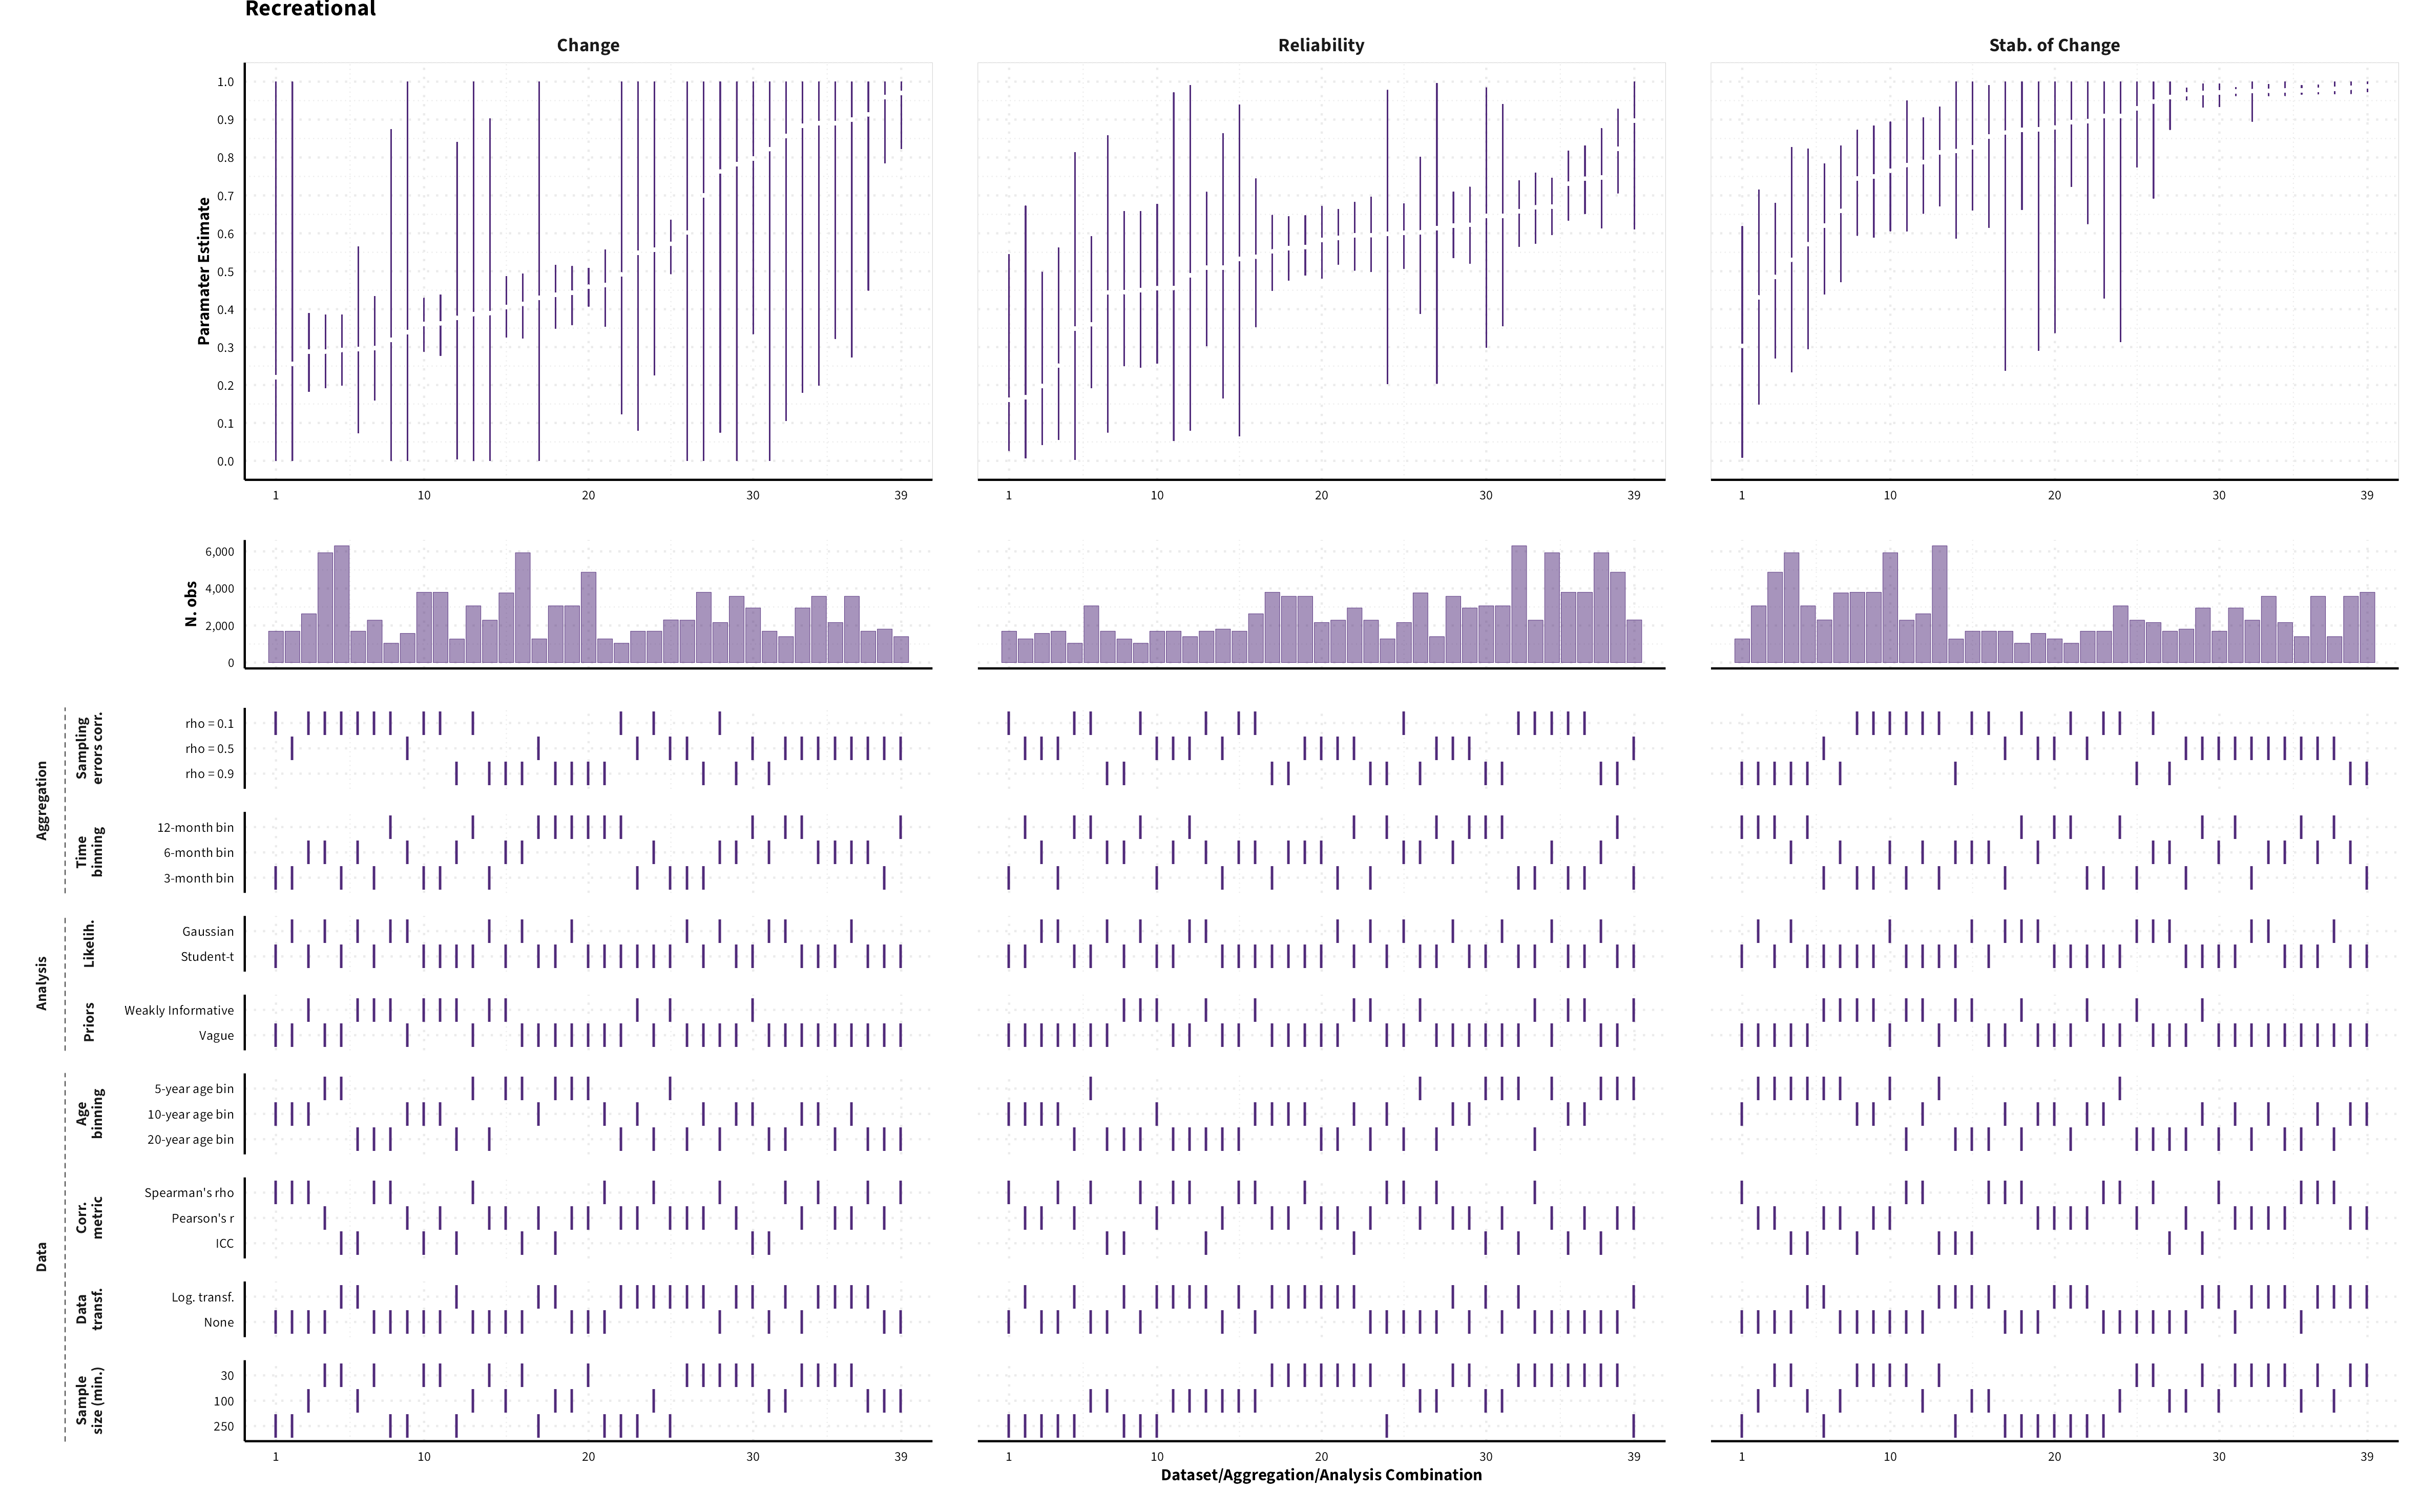
Below we provide an overview of how robust the results reported in the main paper are to different data processing and analysis decisions. To do so, we conducted the same (main) analyses using data sets derived from other combinations of data processing and model specification decisions (see diagram below). Refer to the Workflow page for more information on how these analyses were conducted
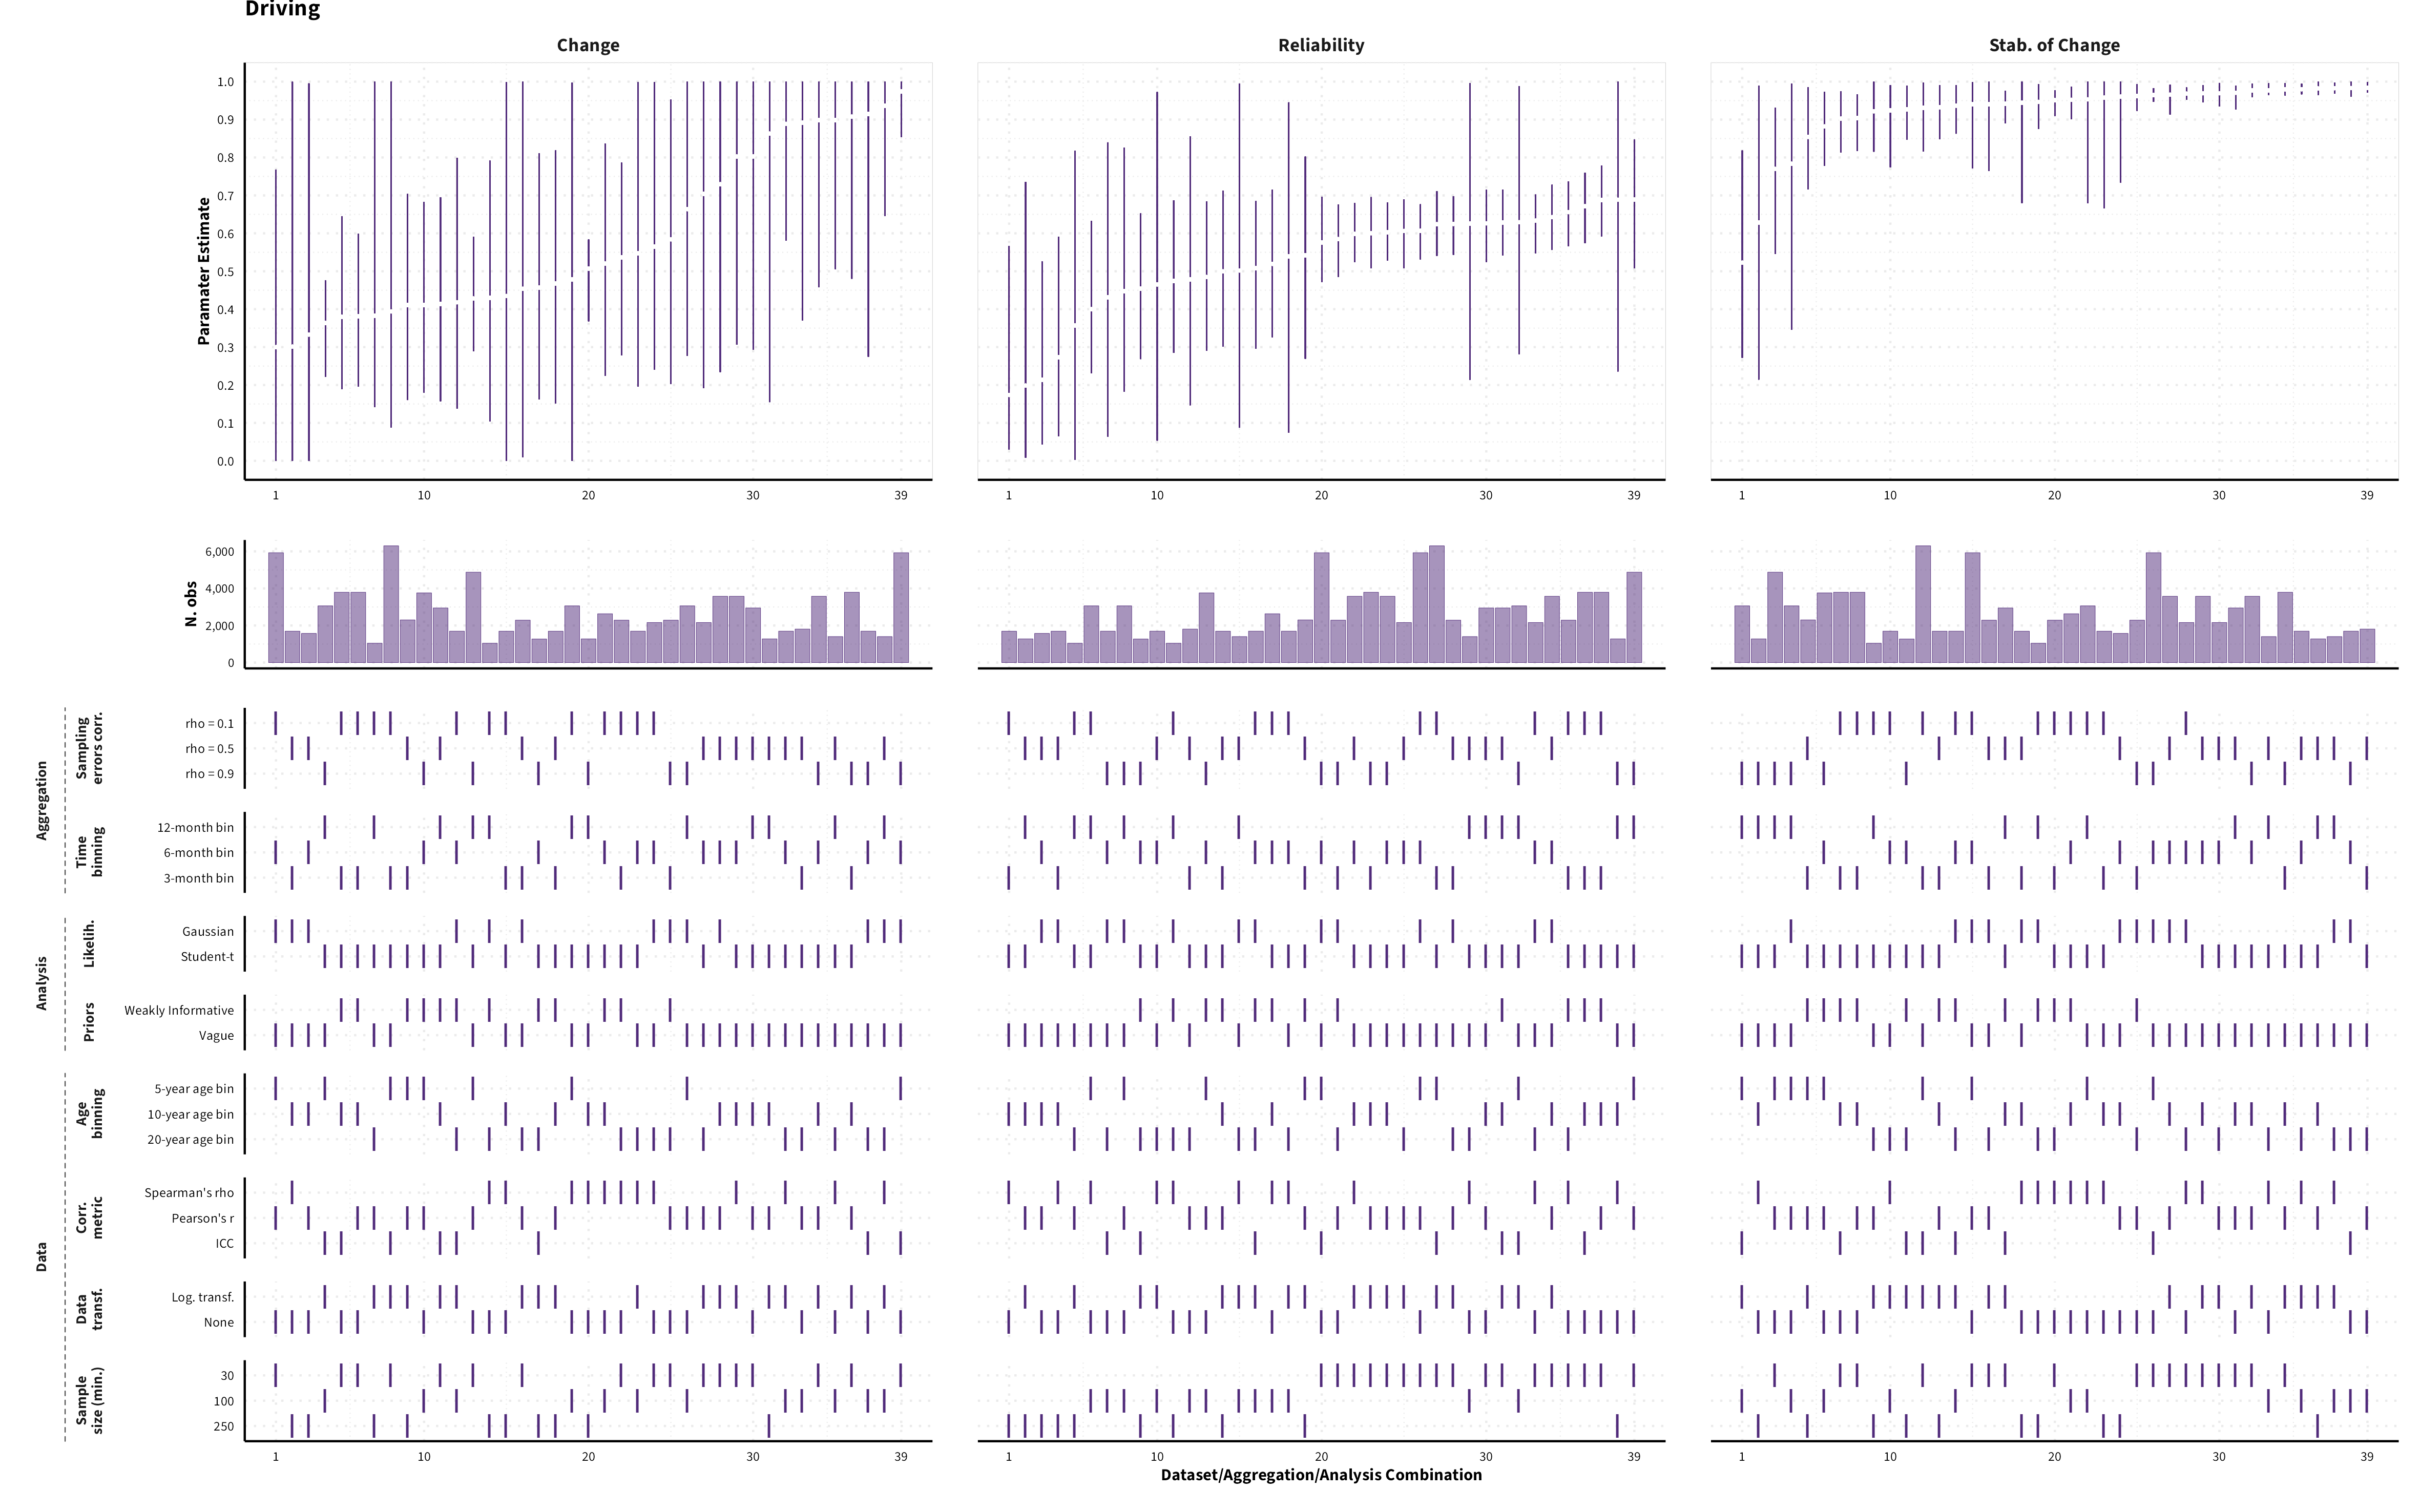
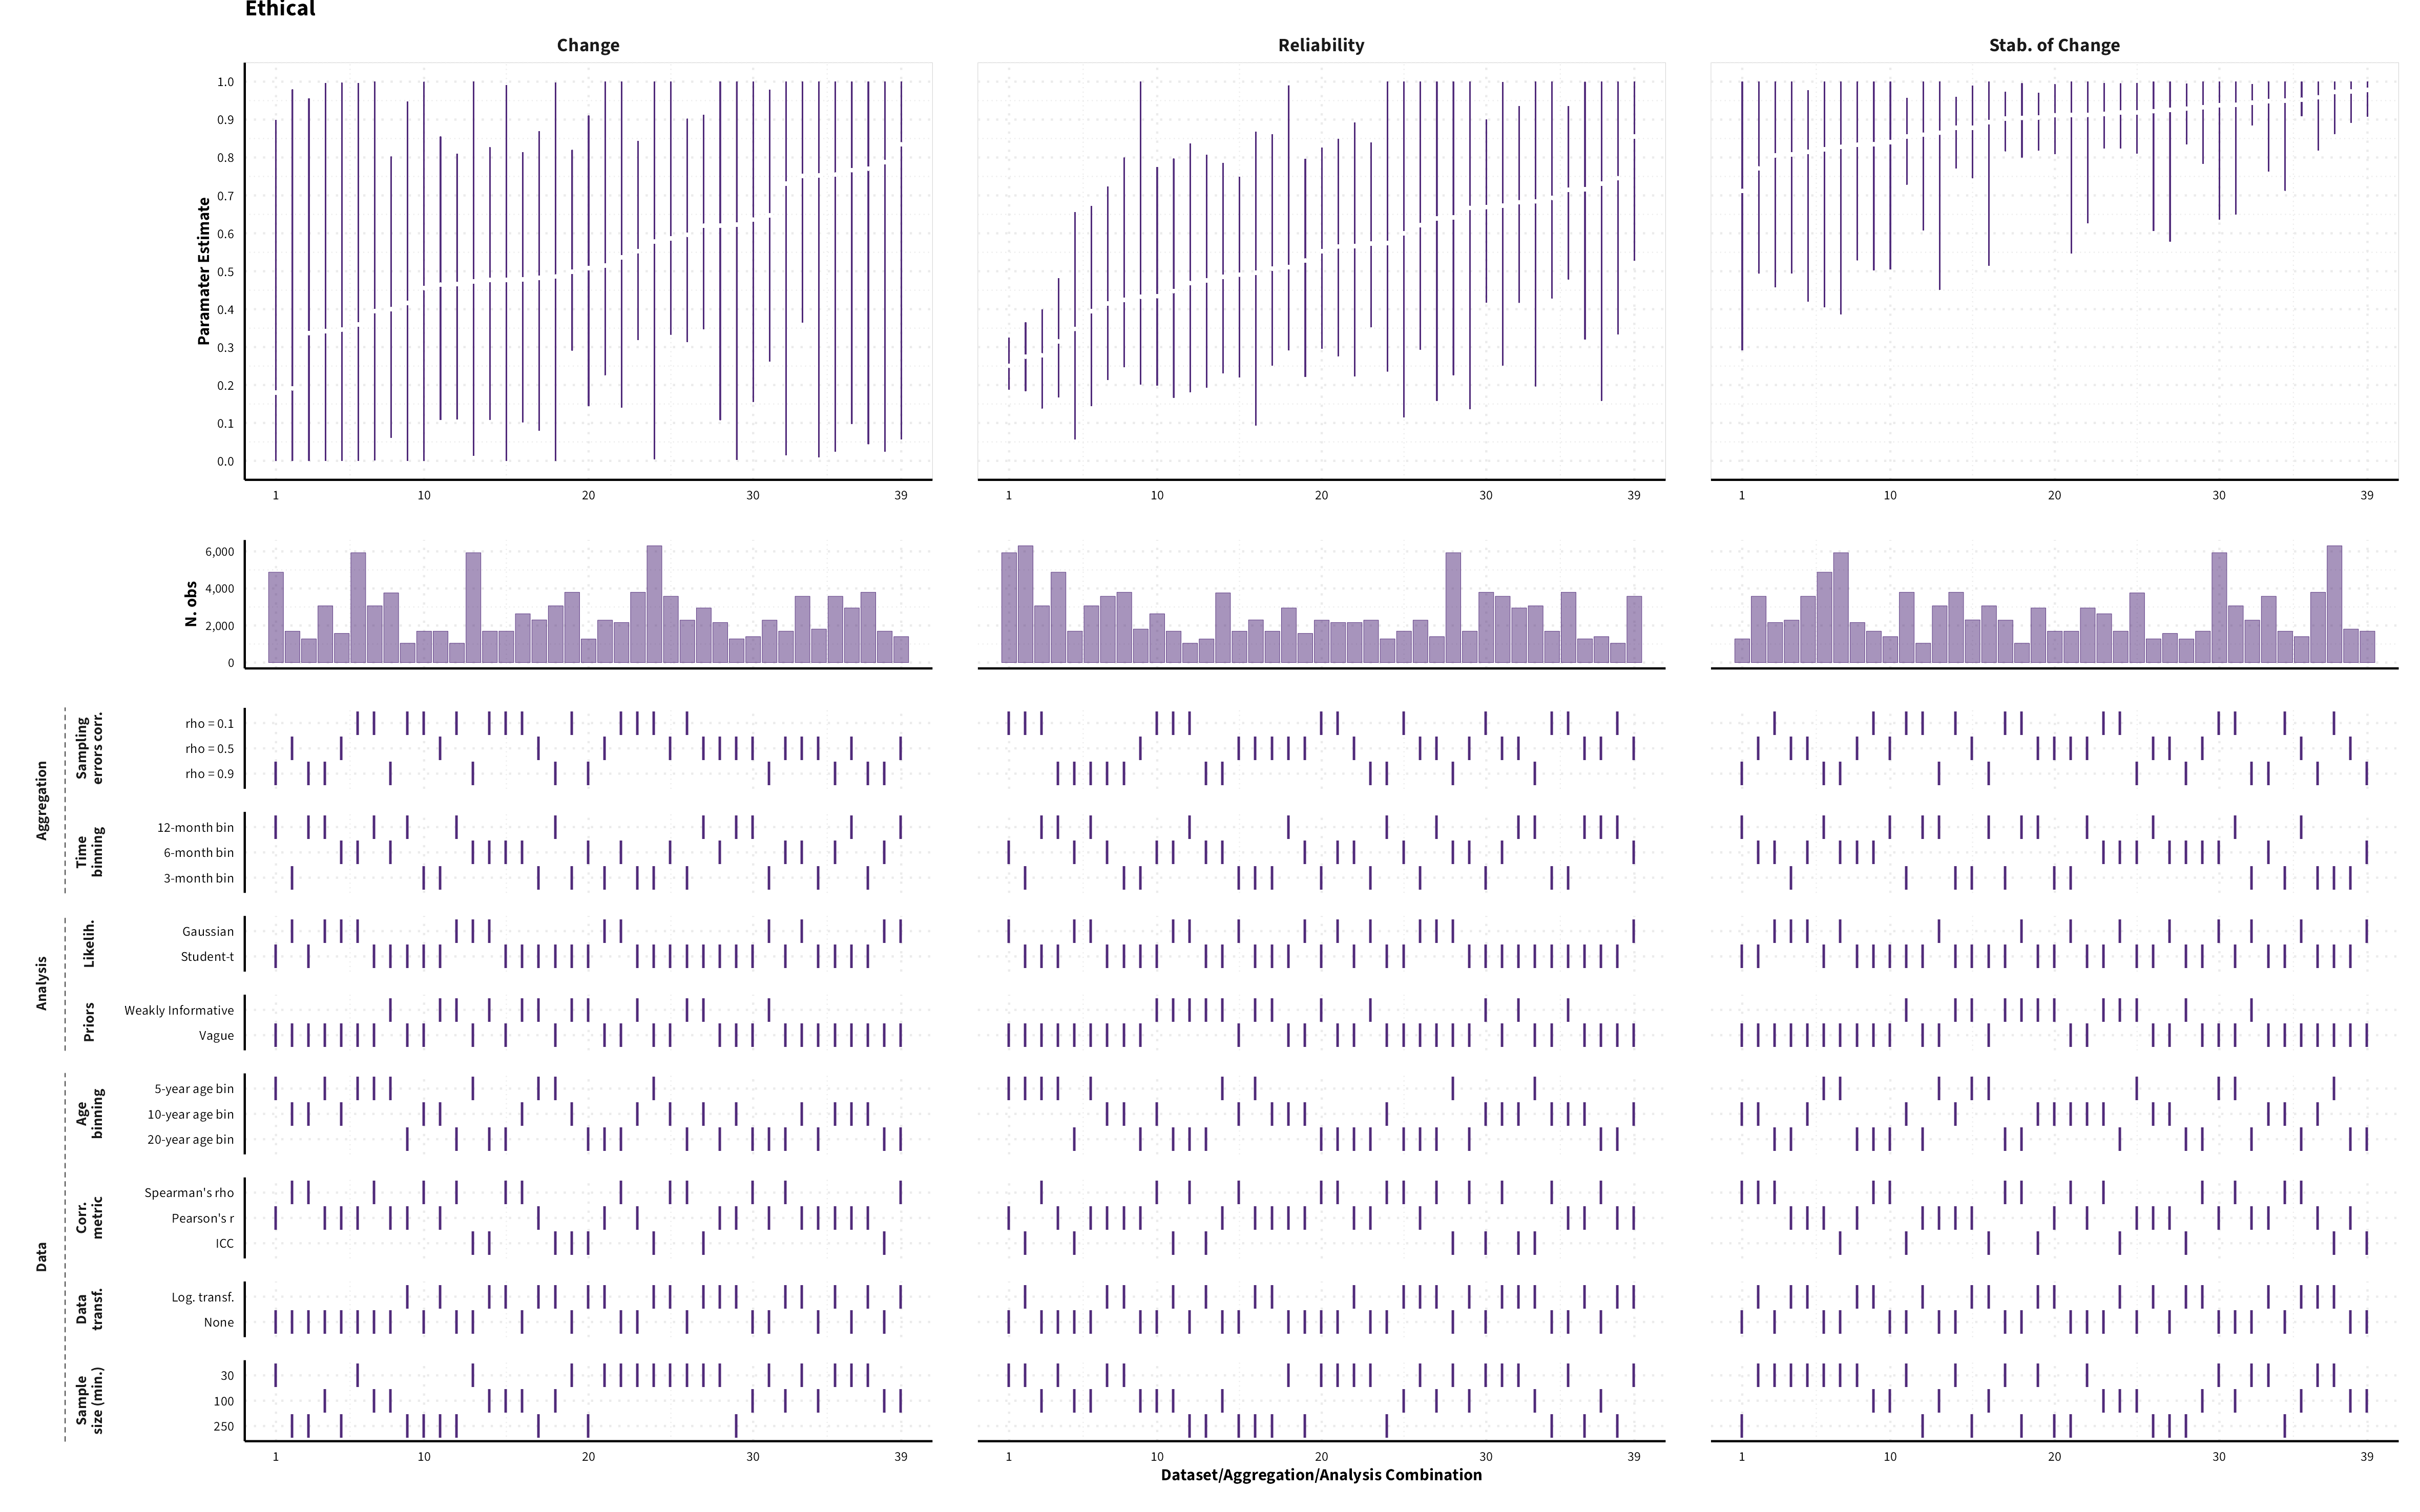
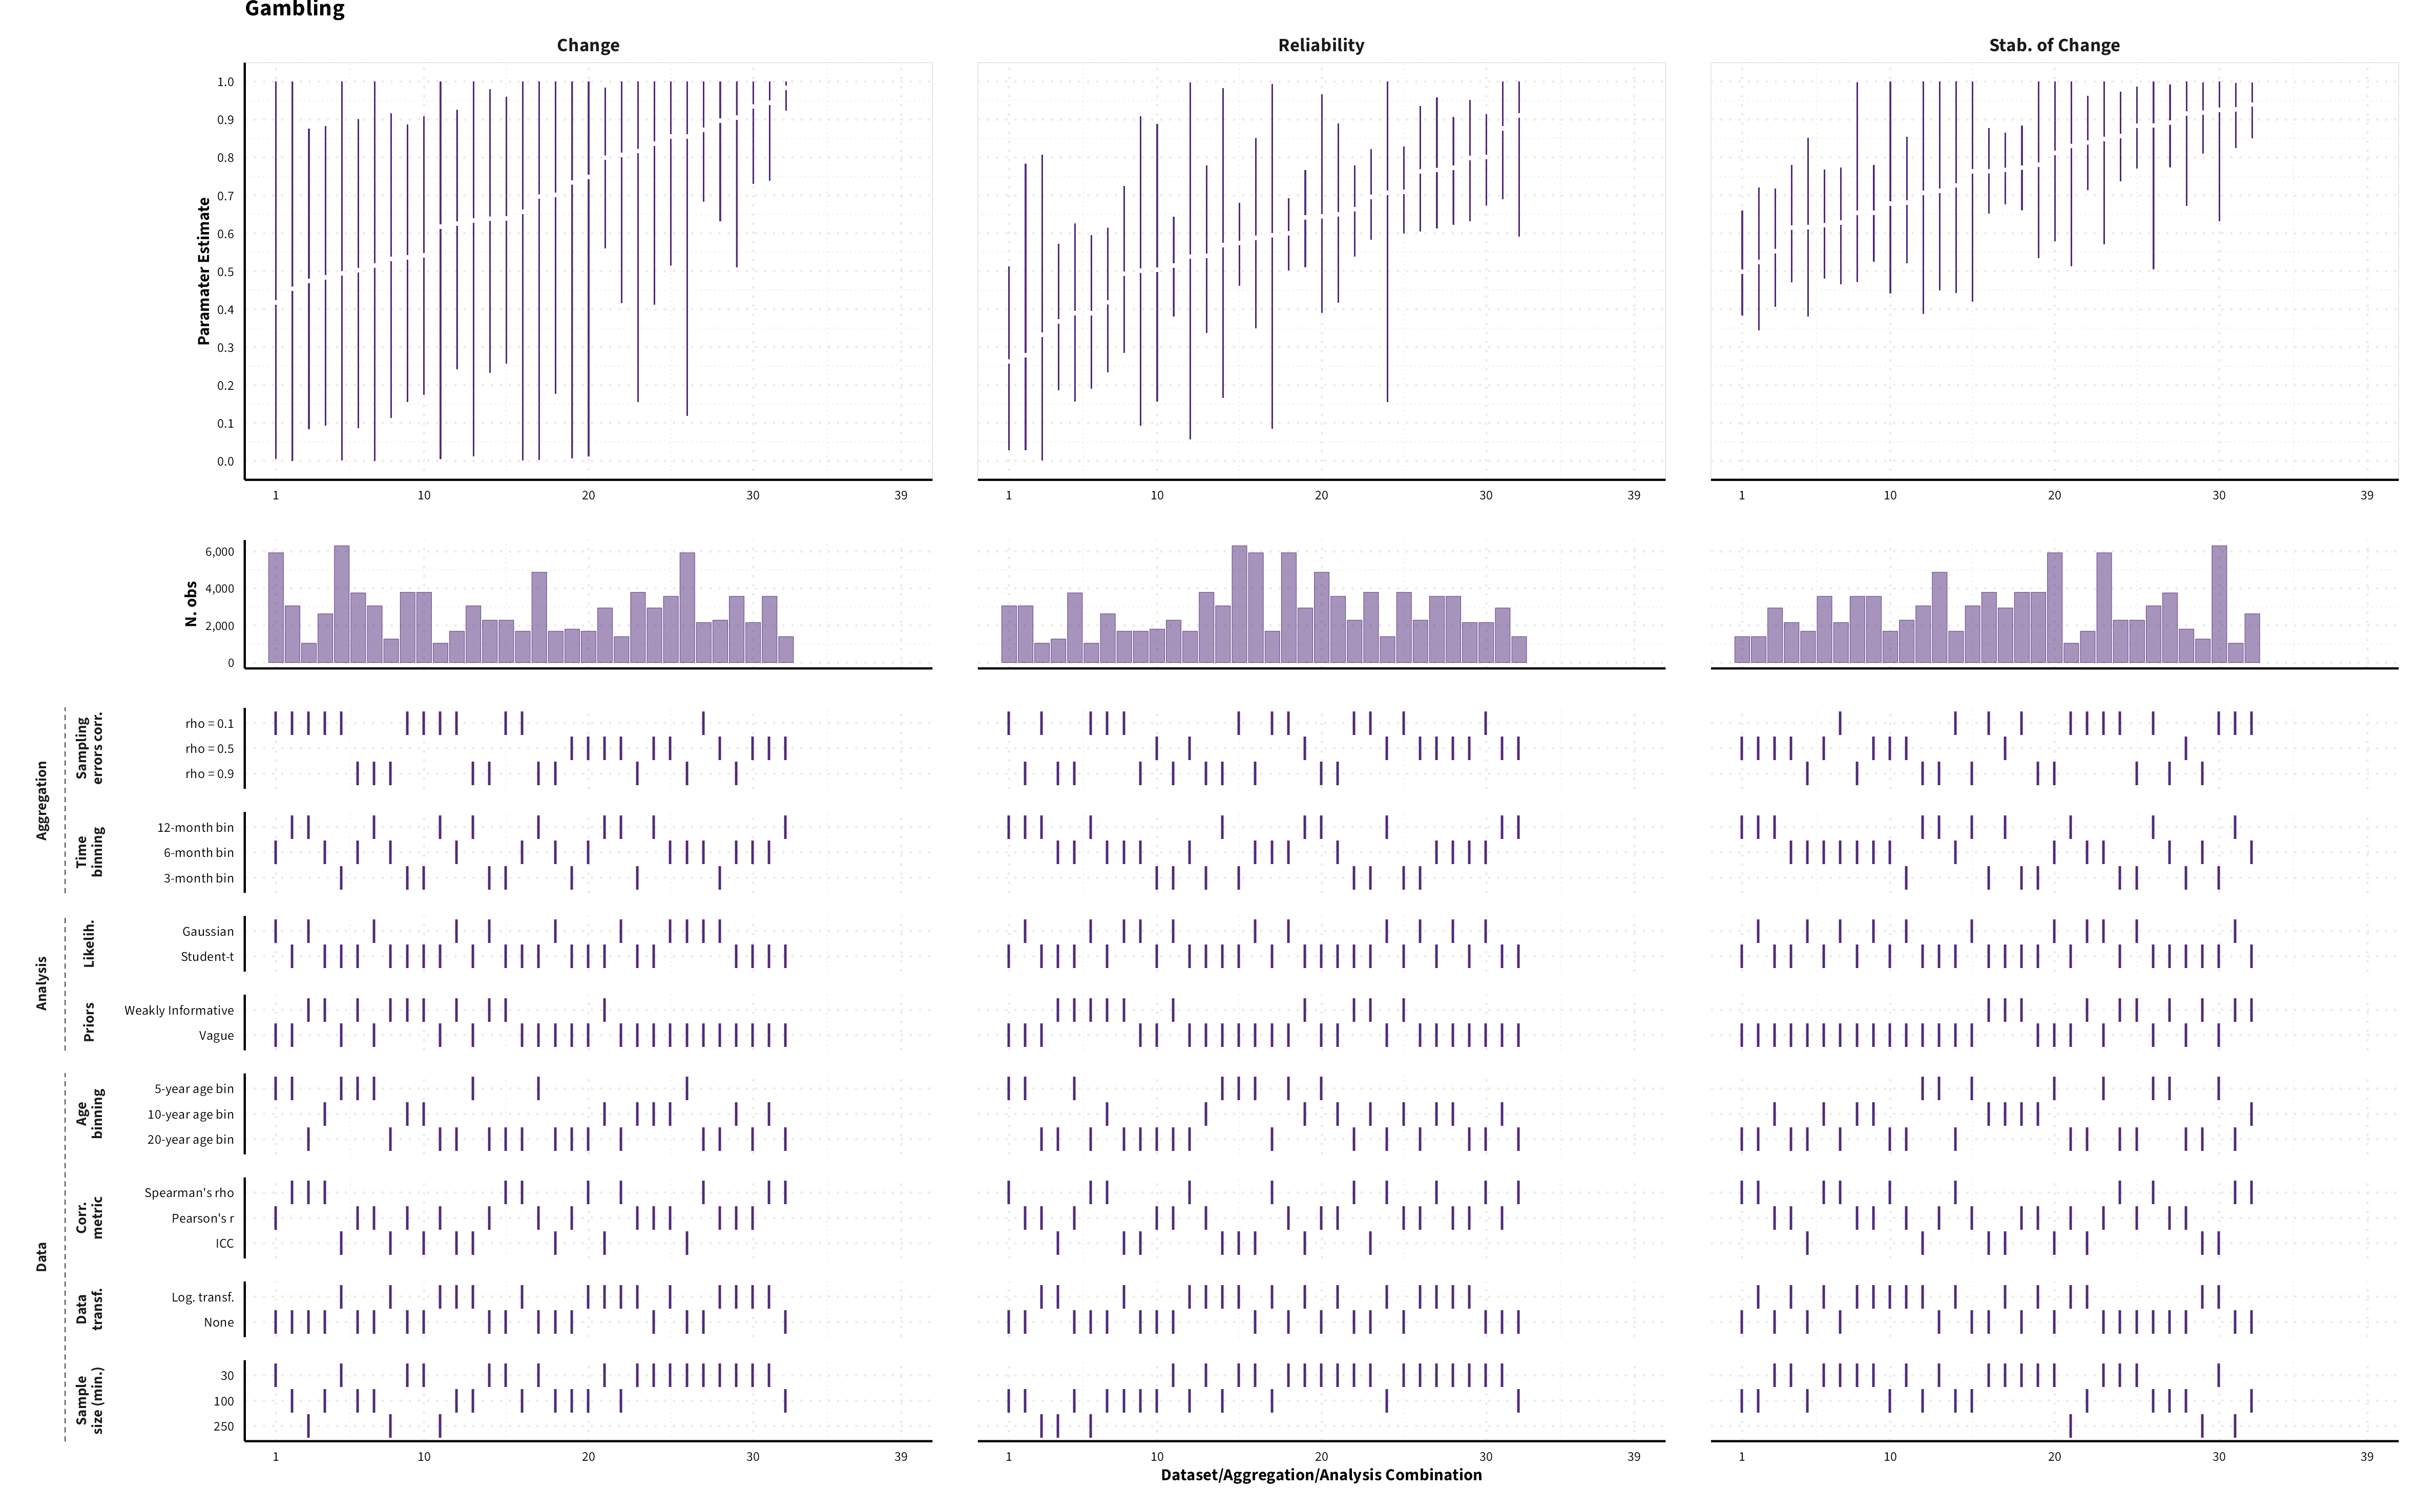
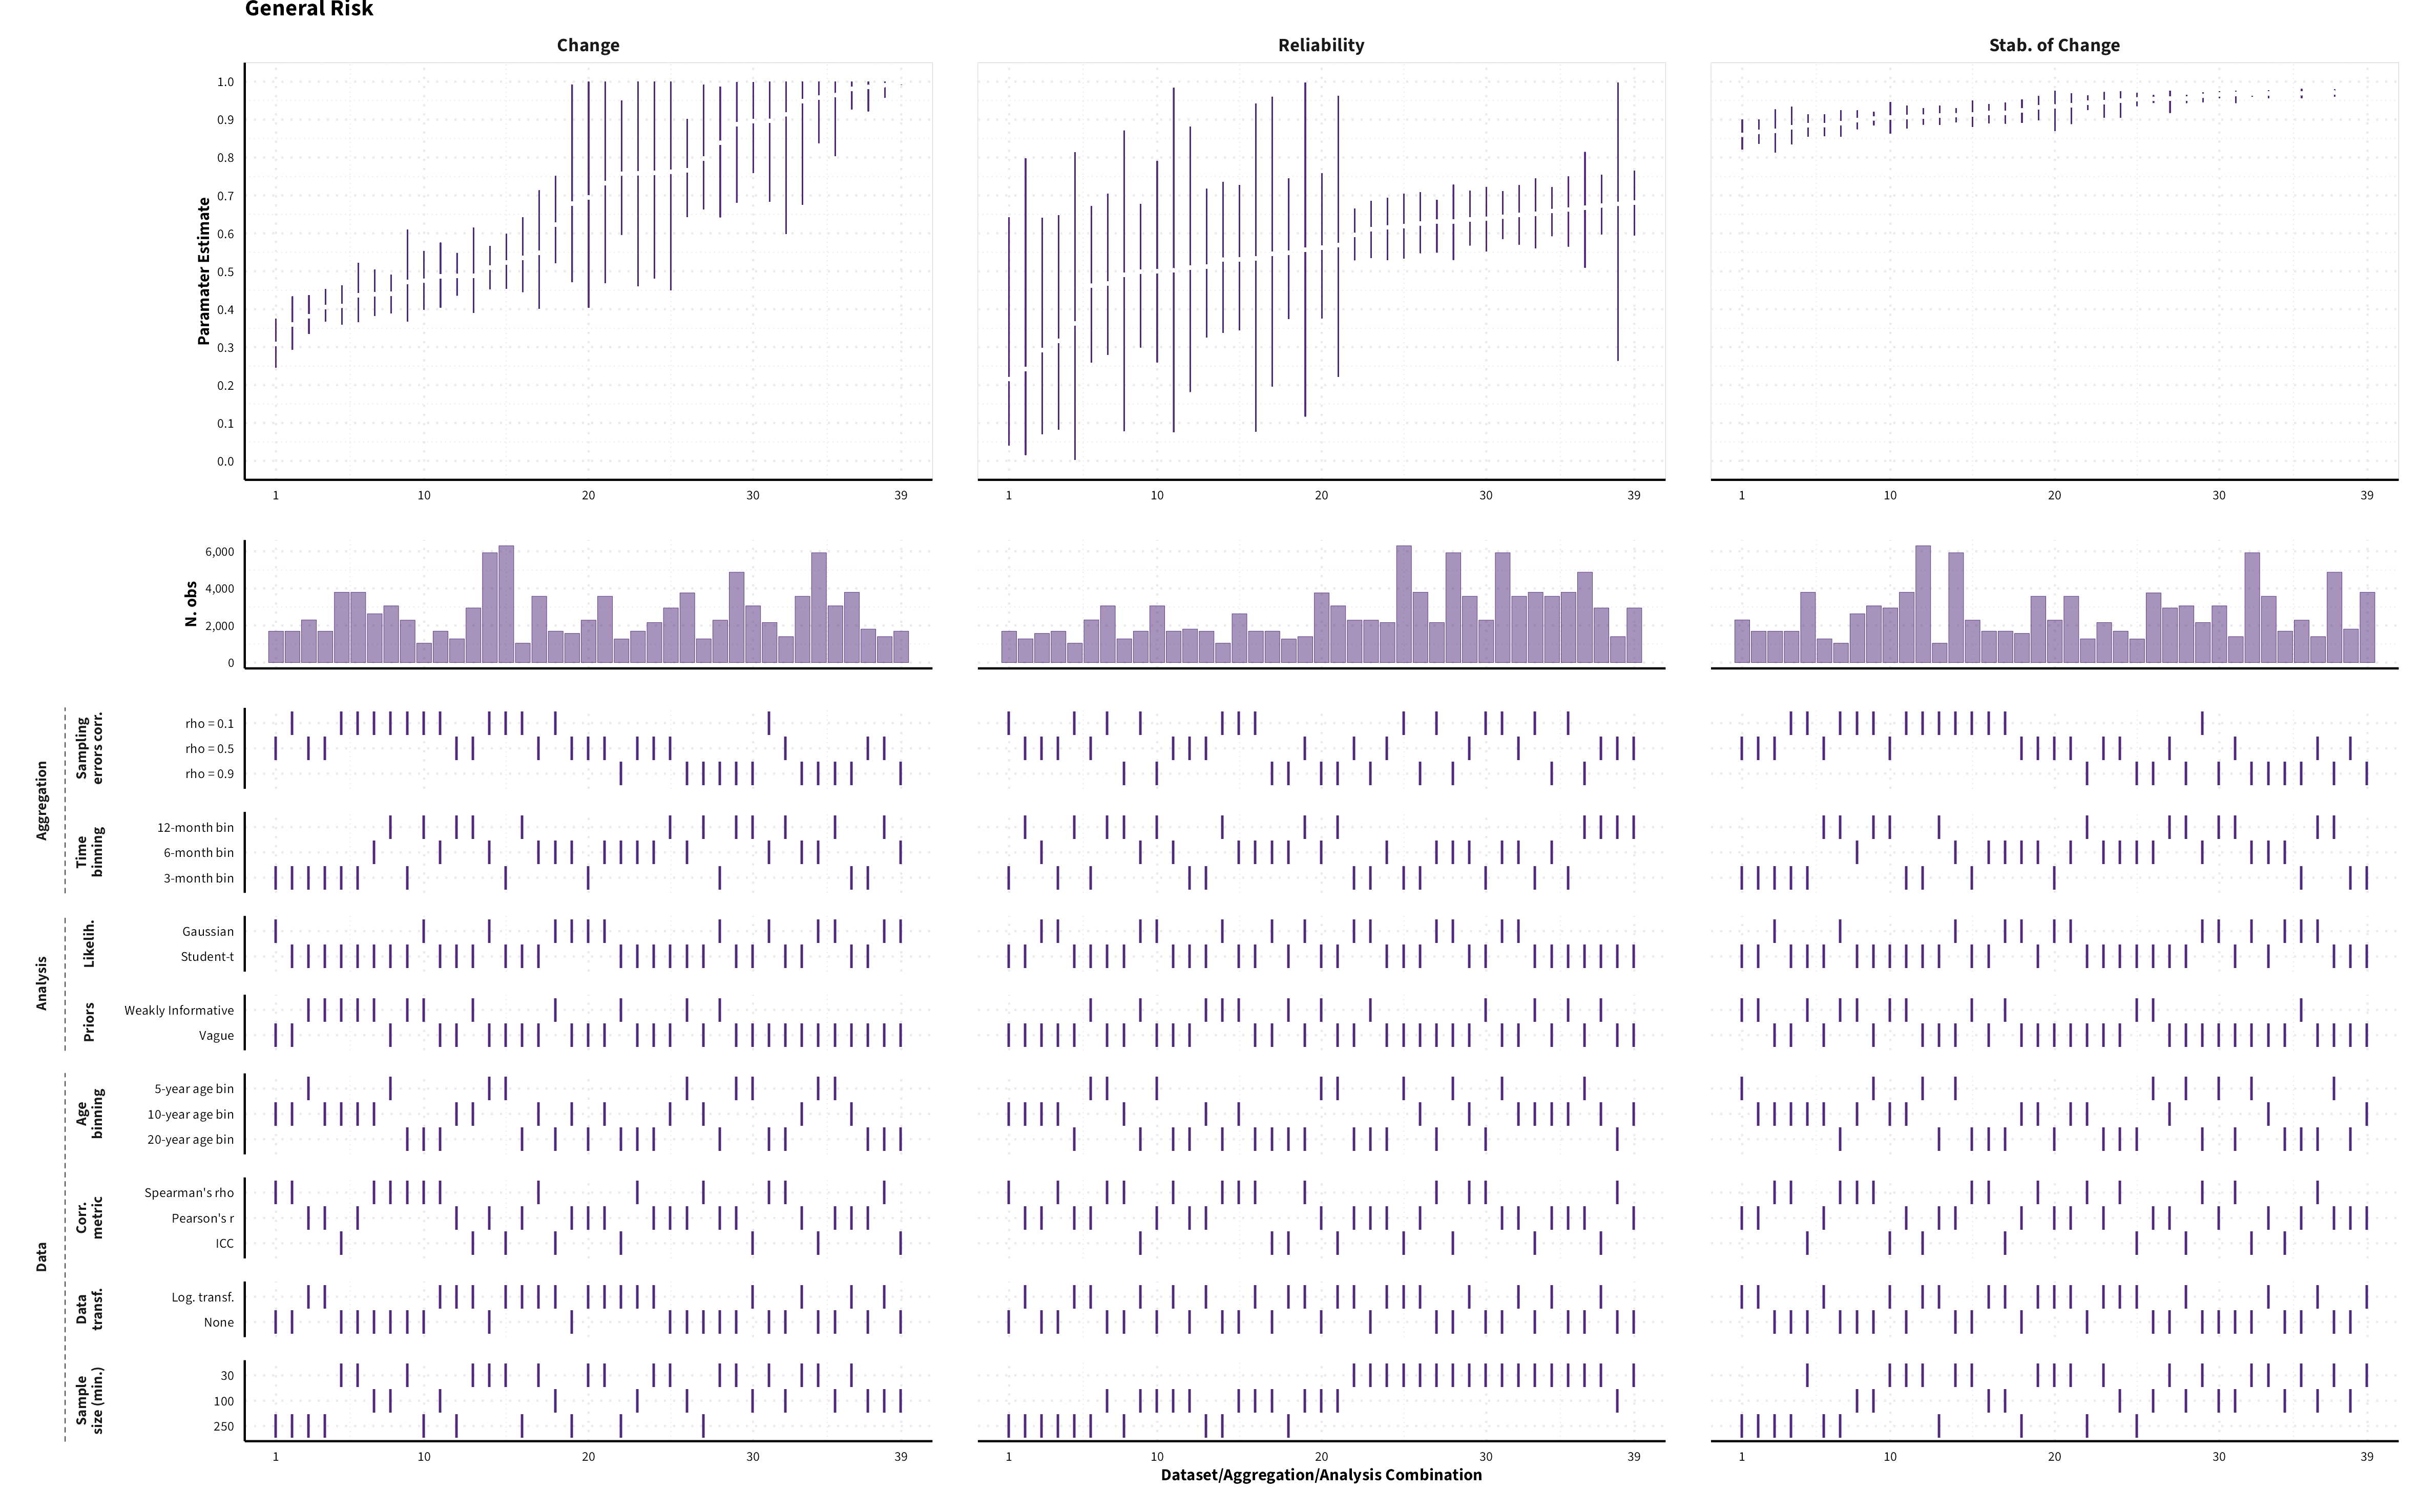
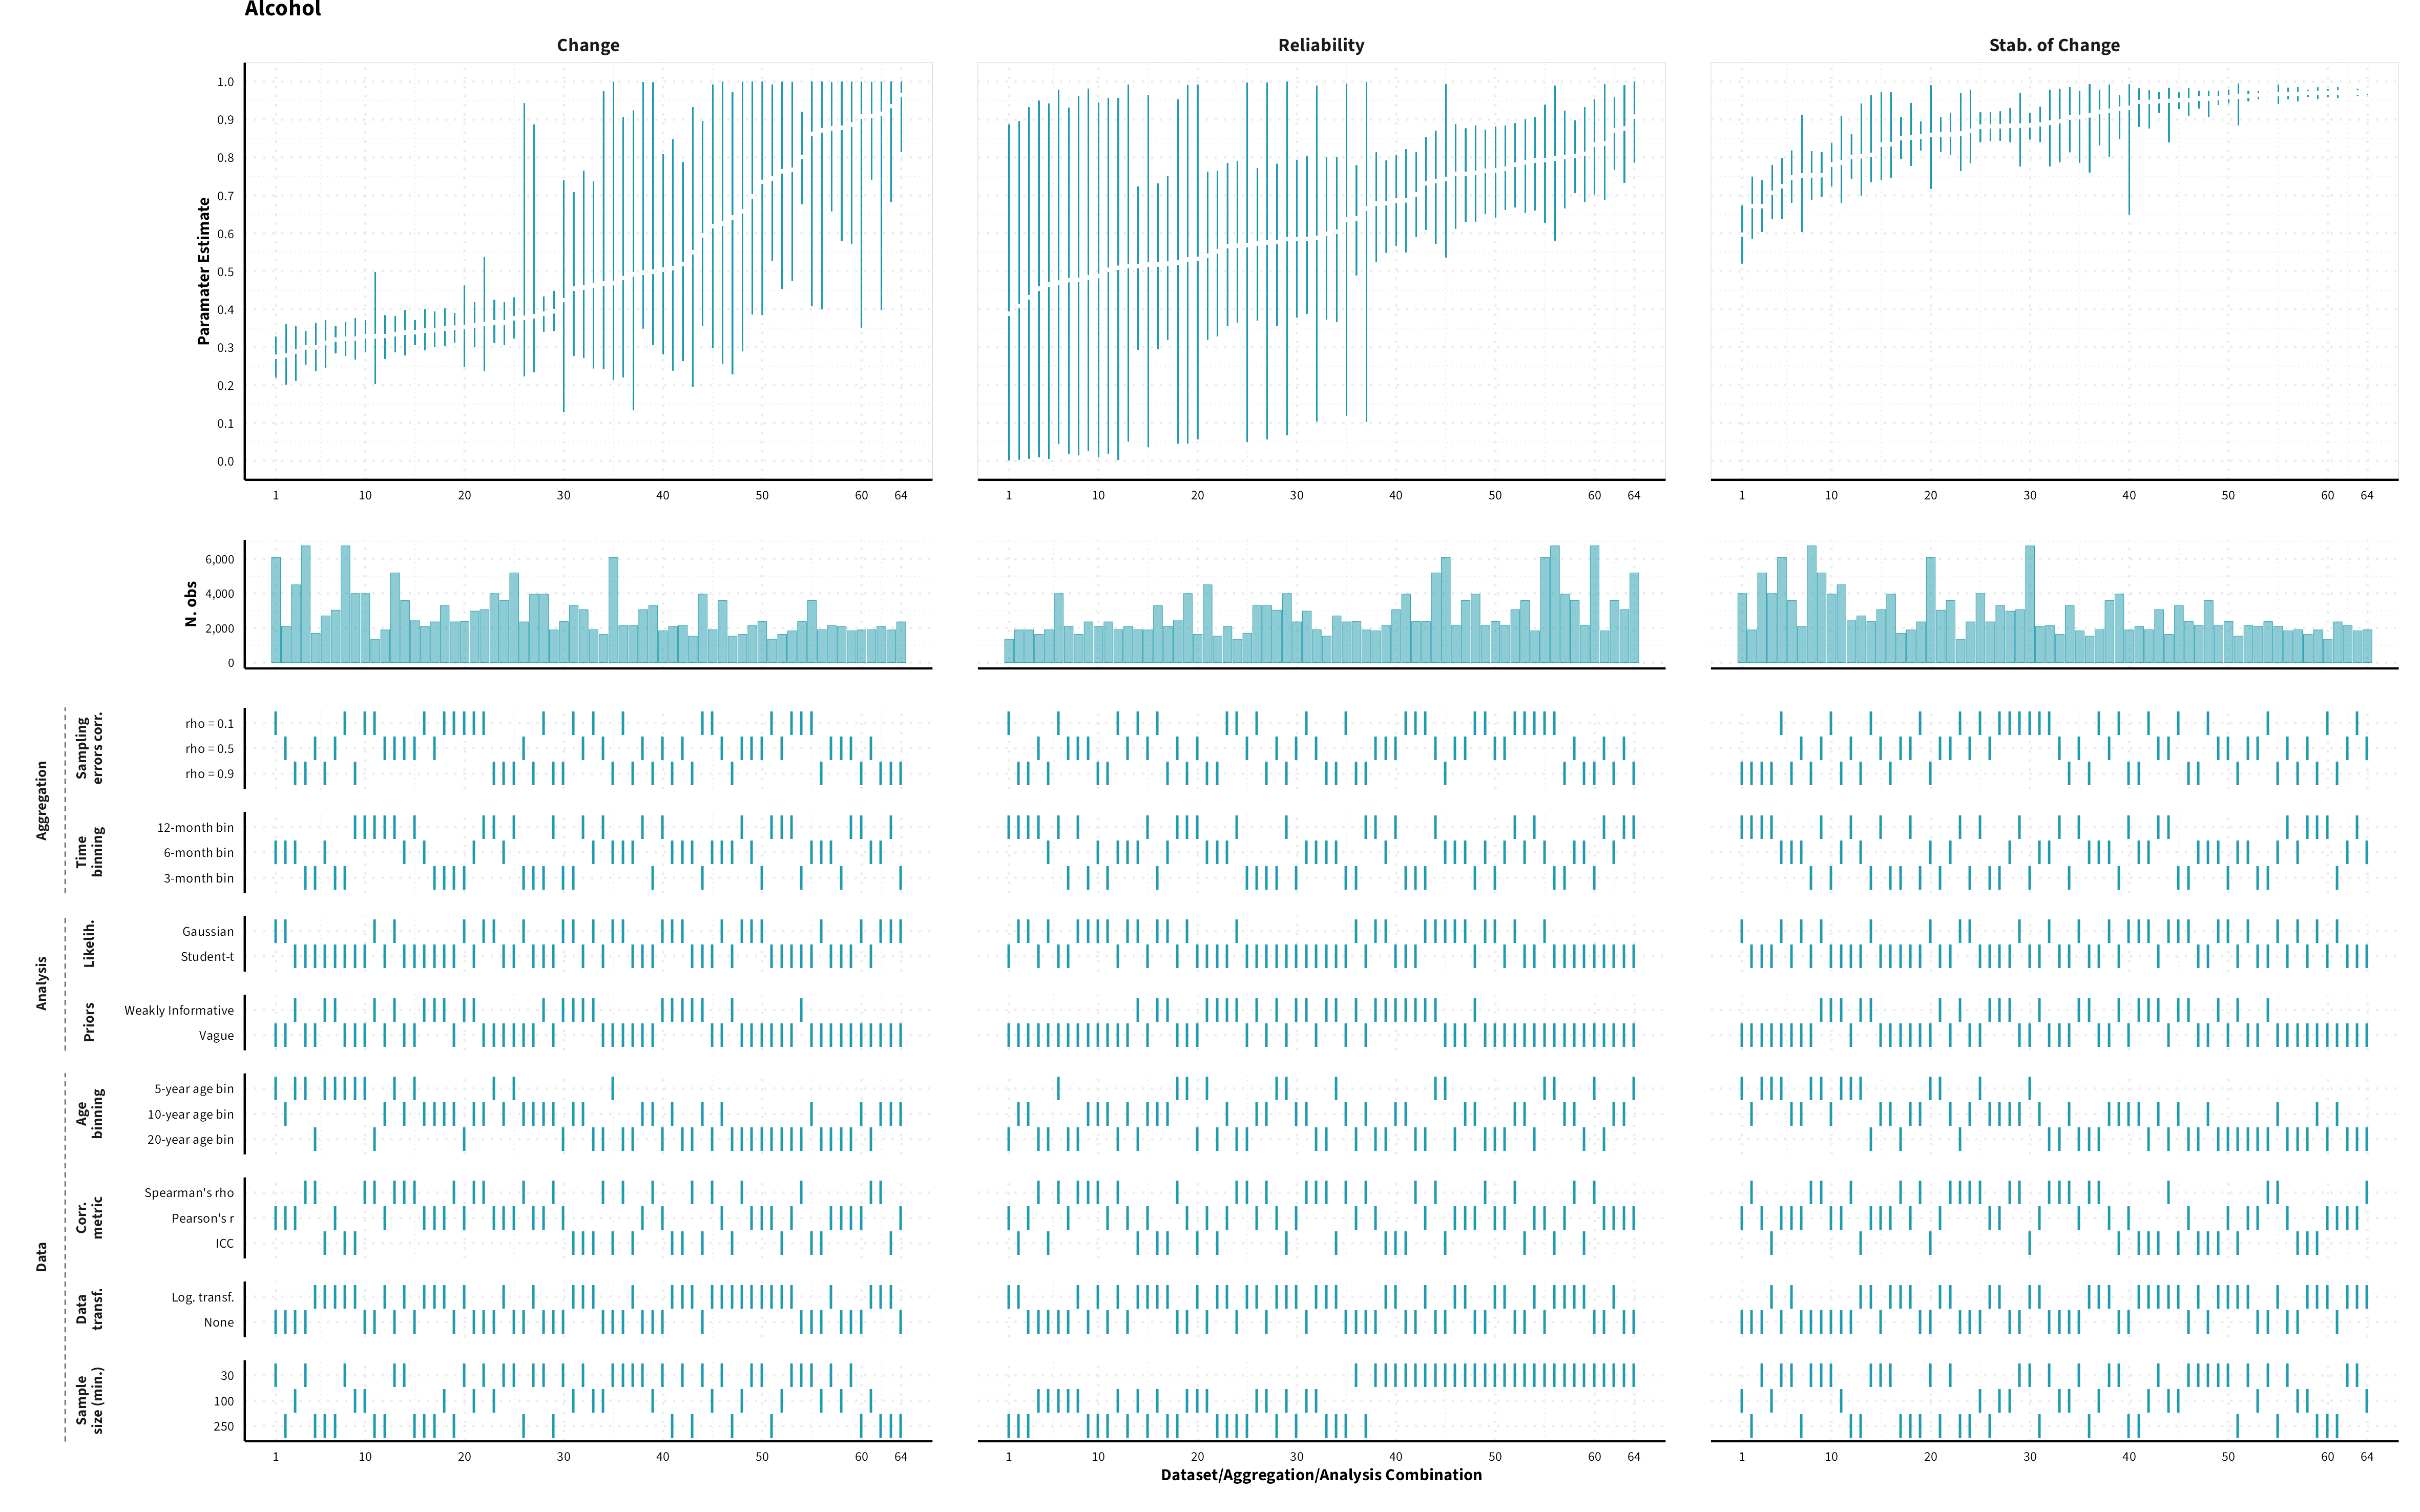
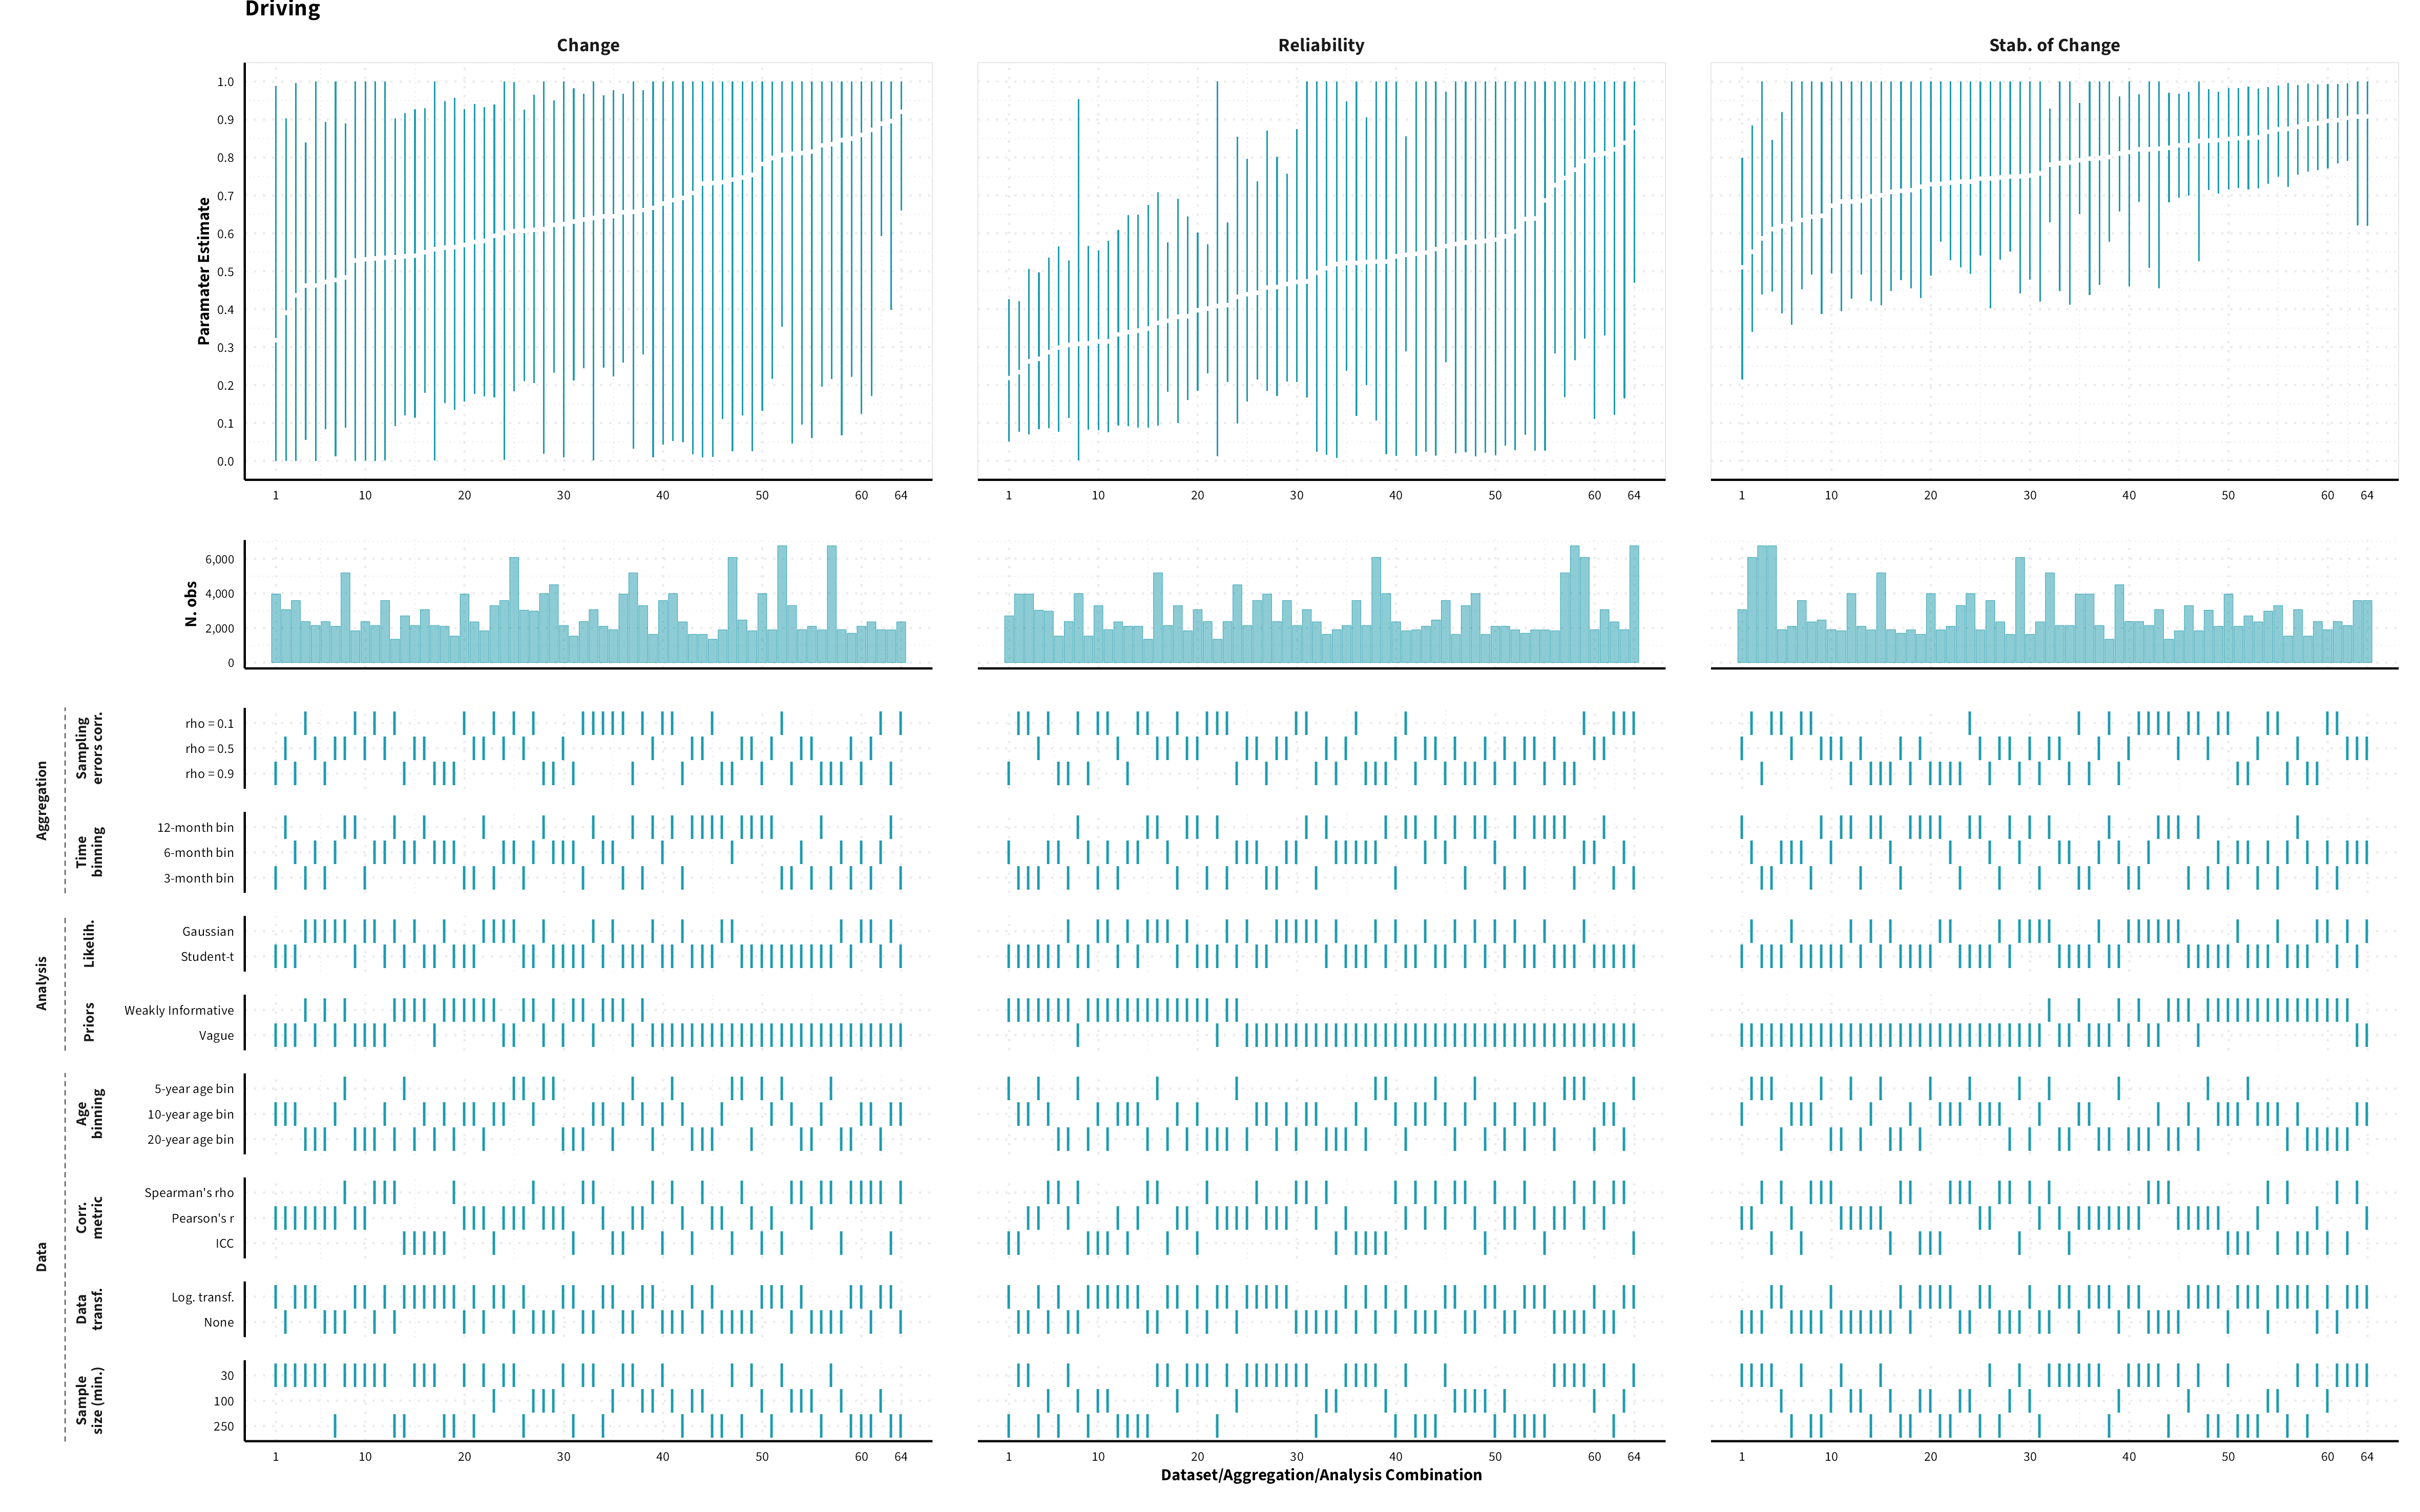
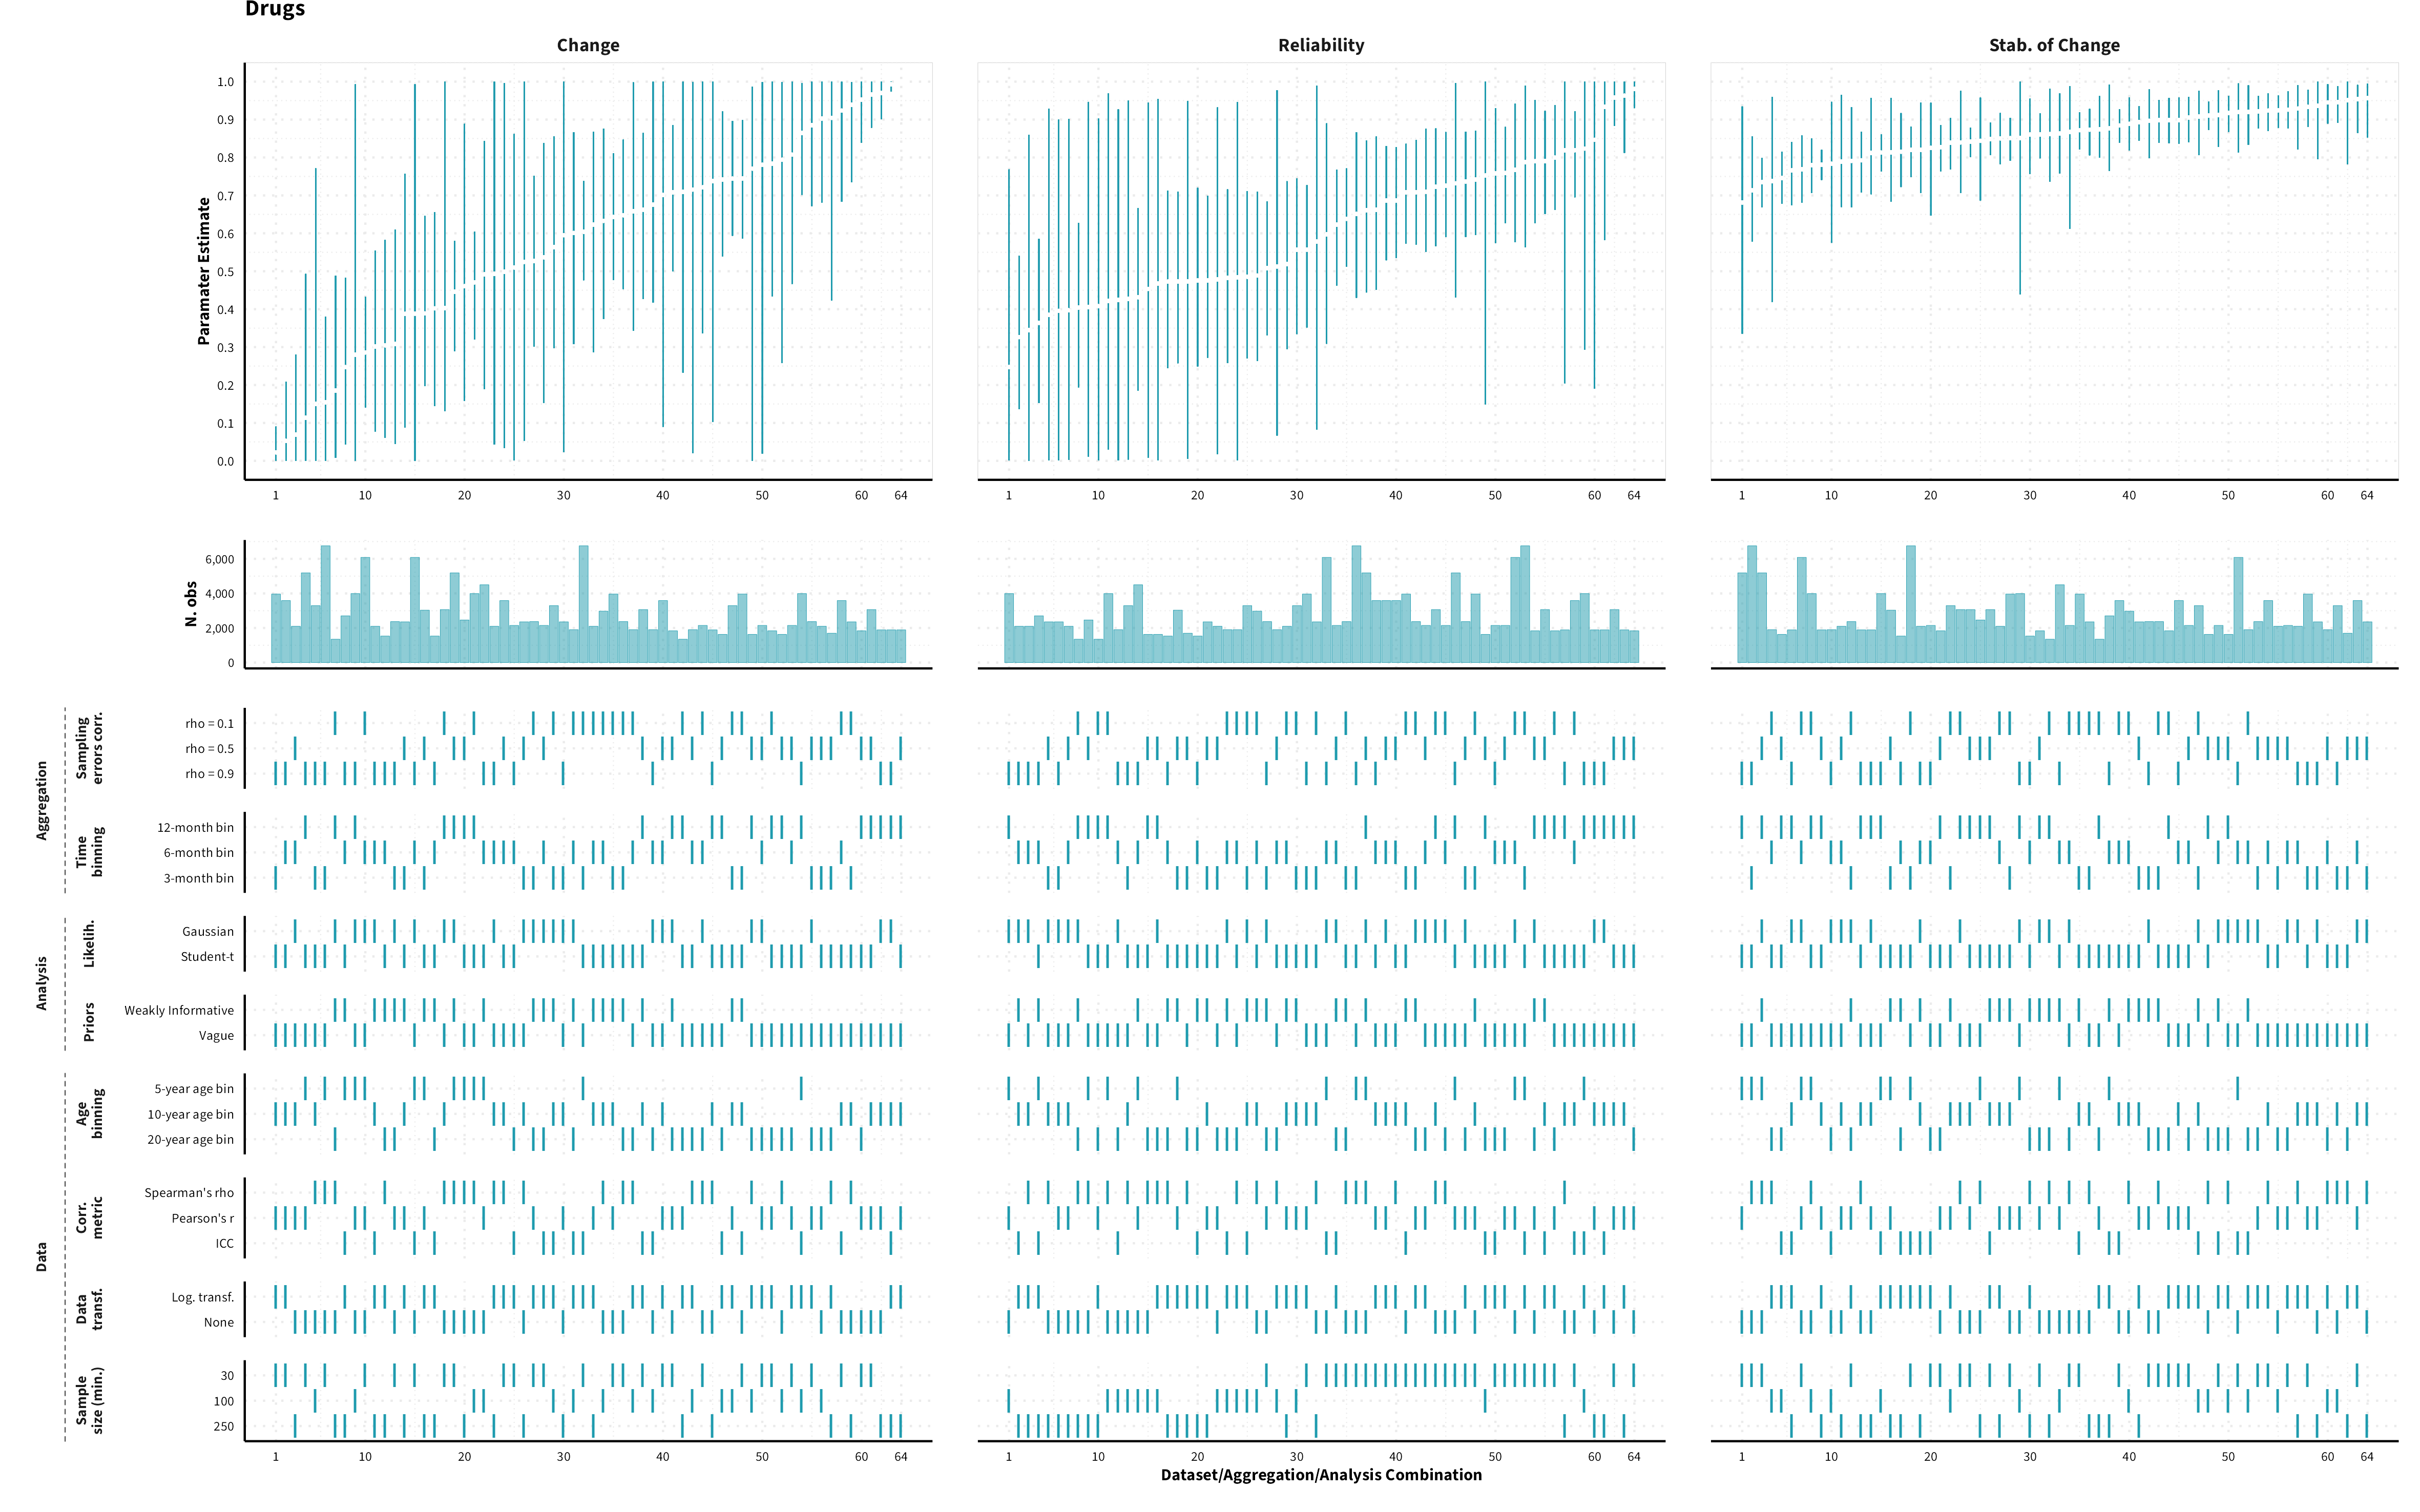
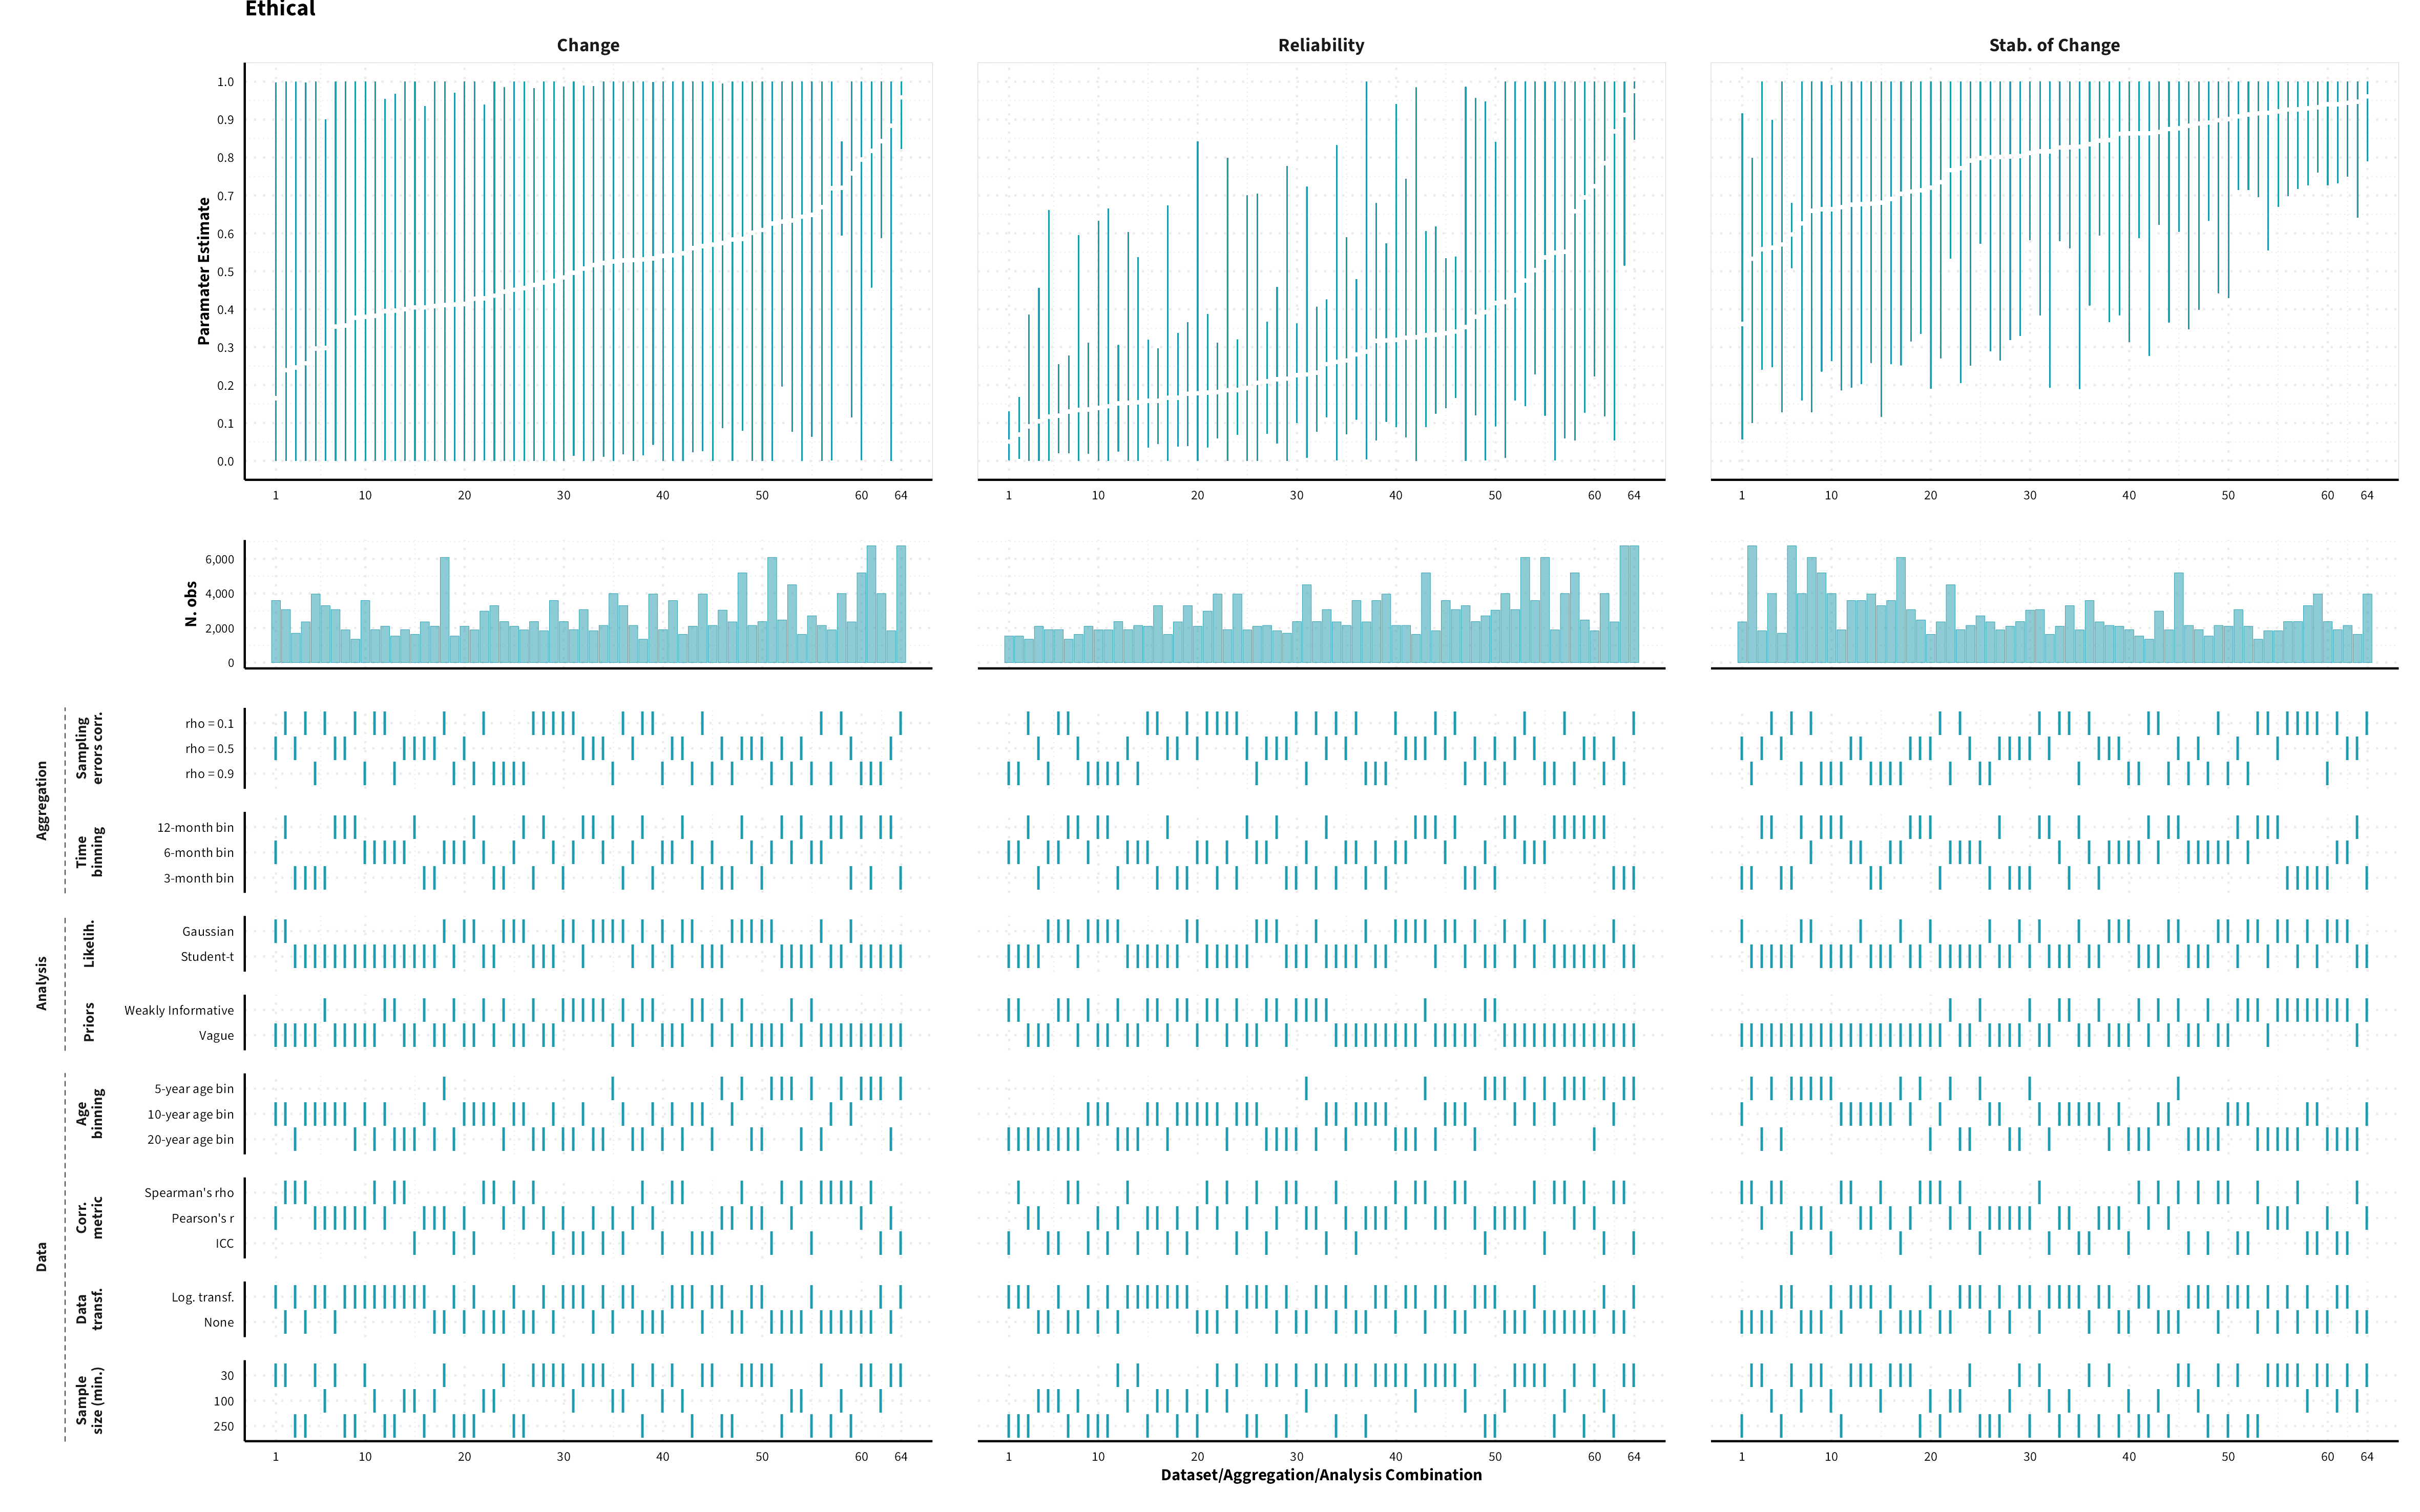
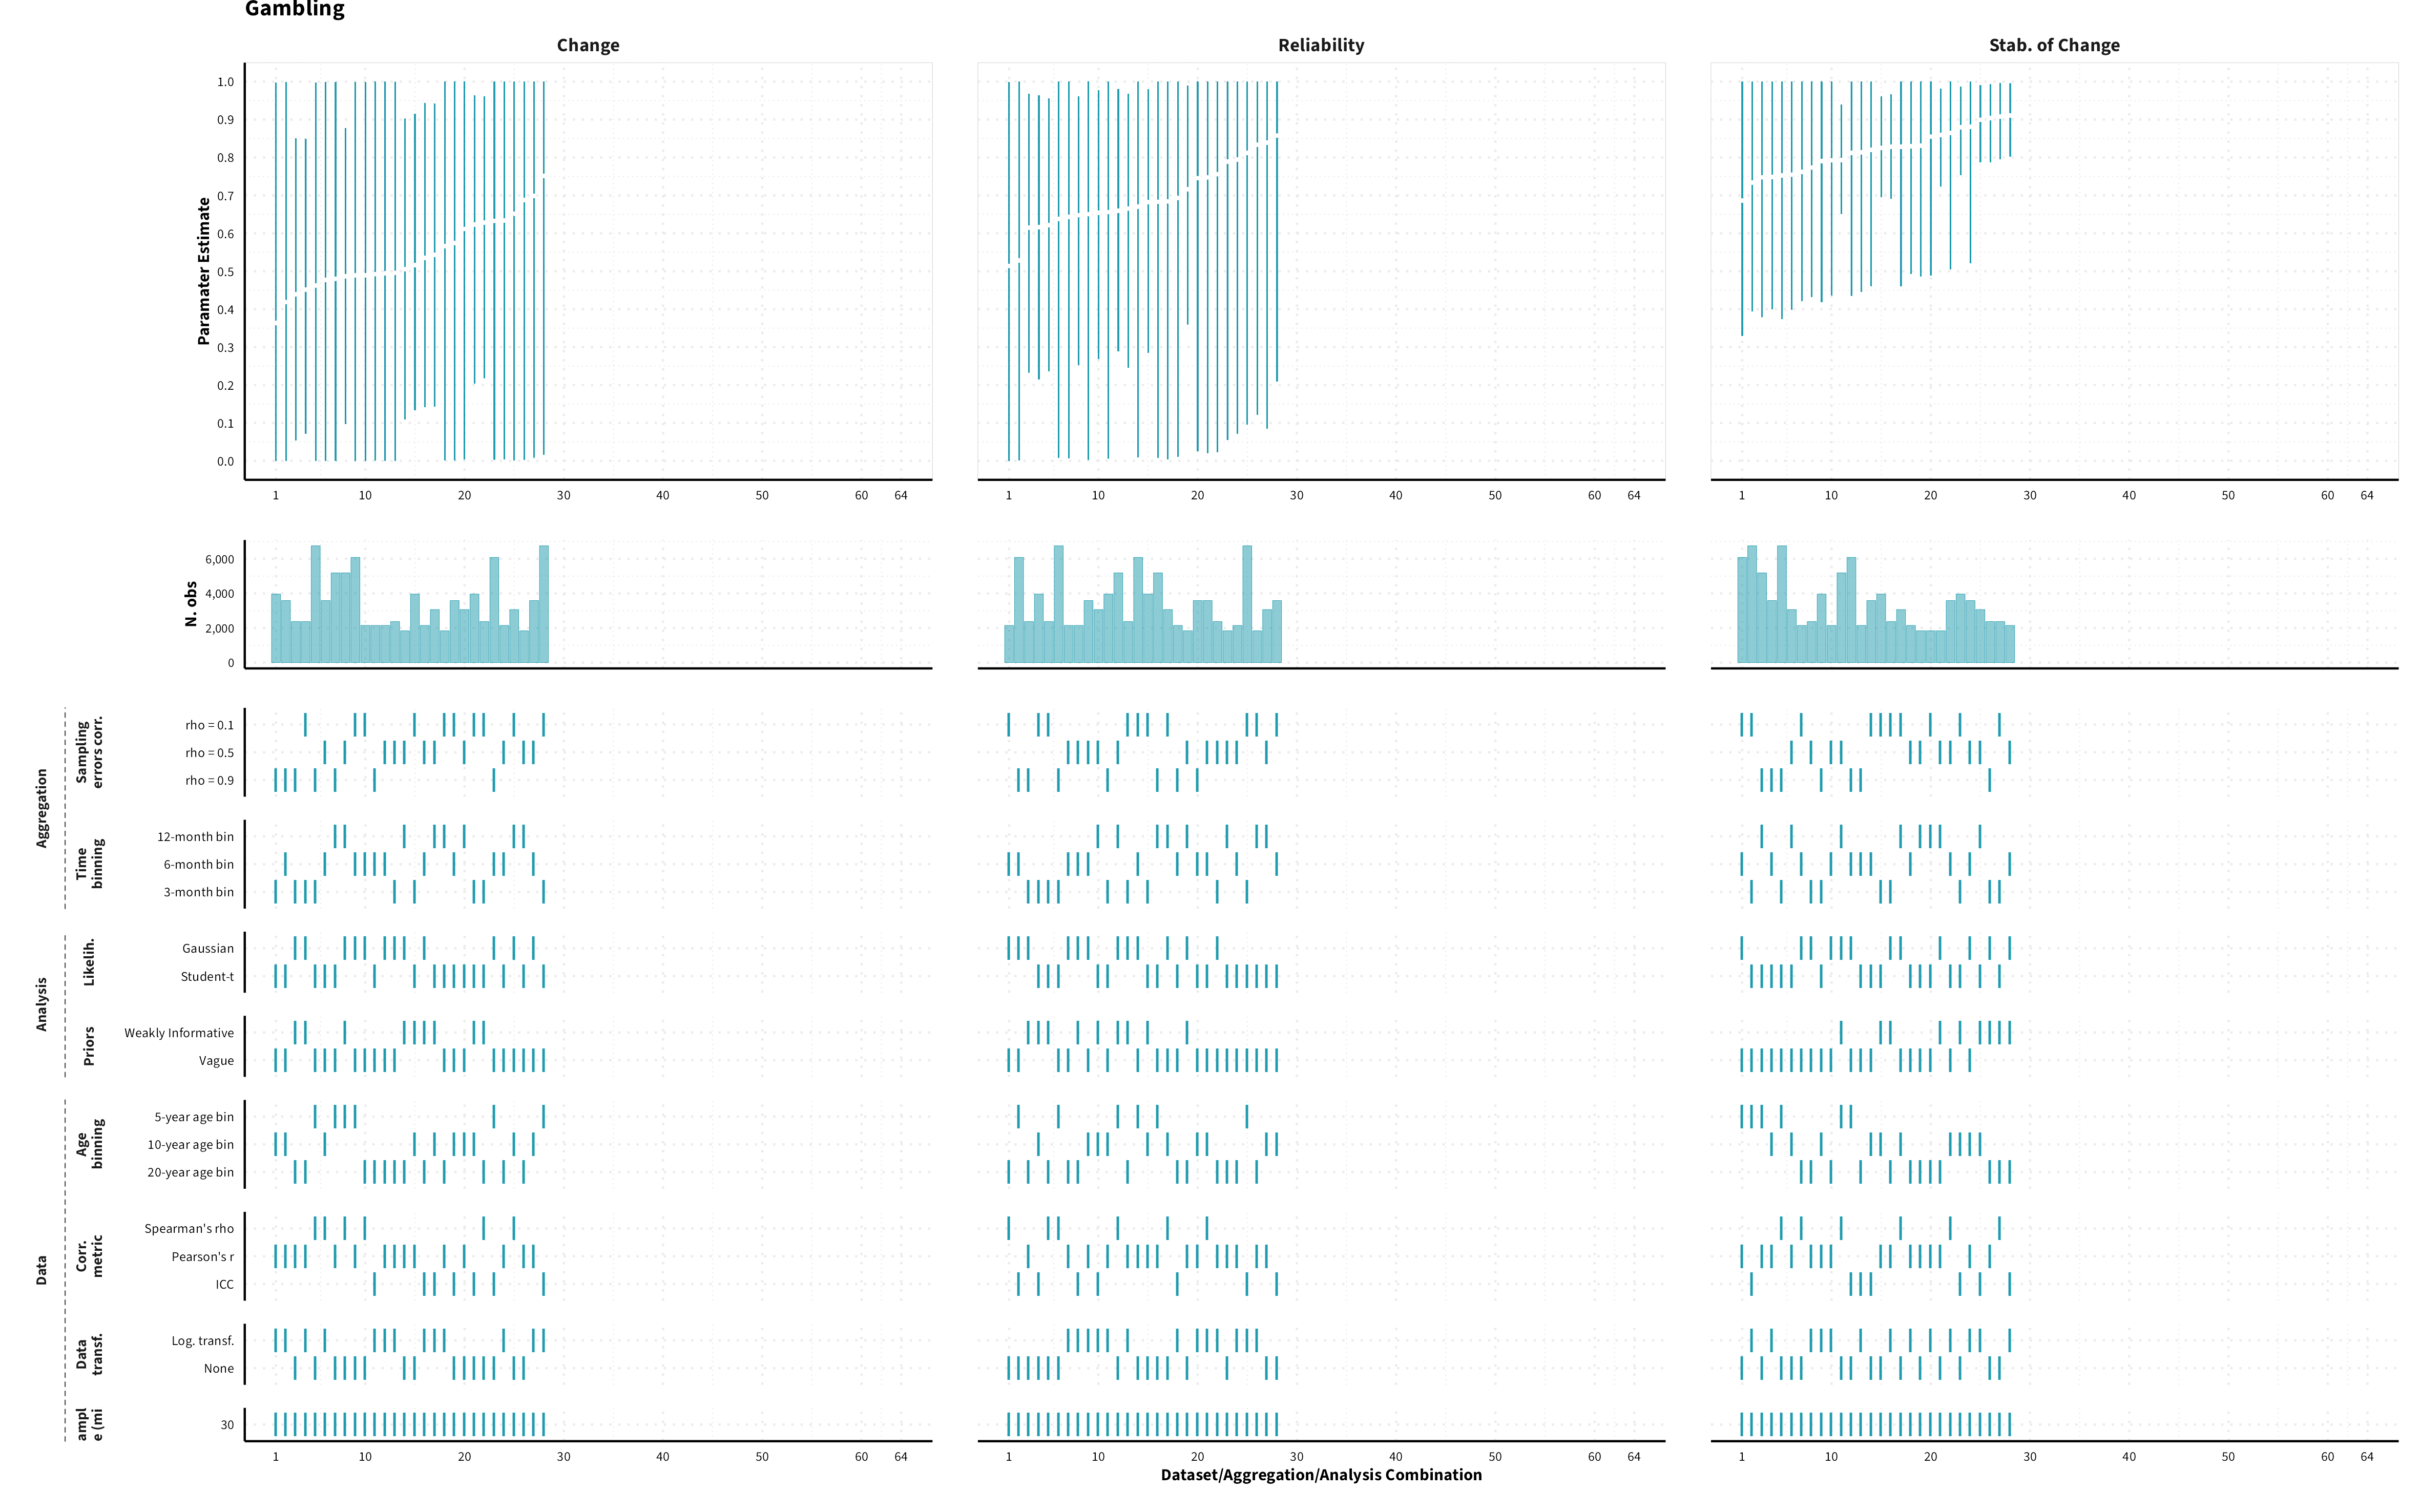
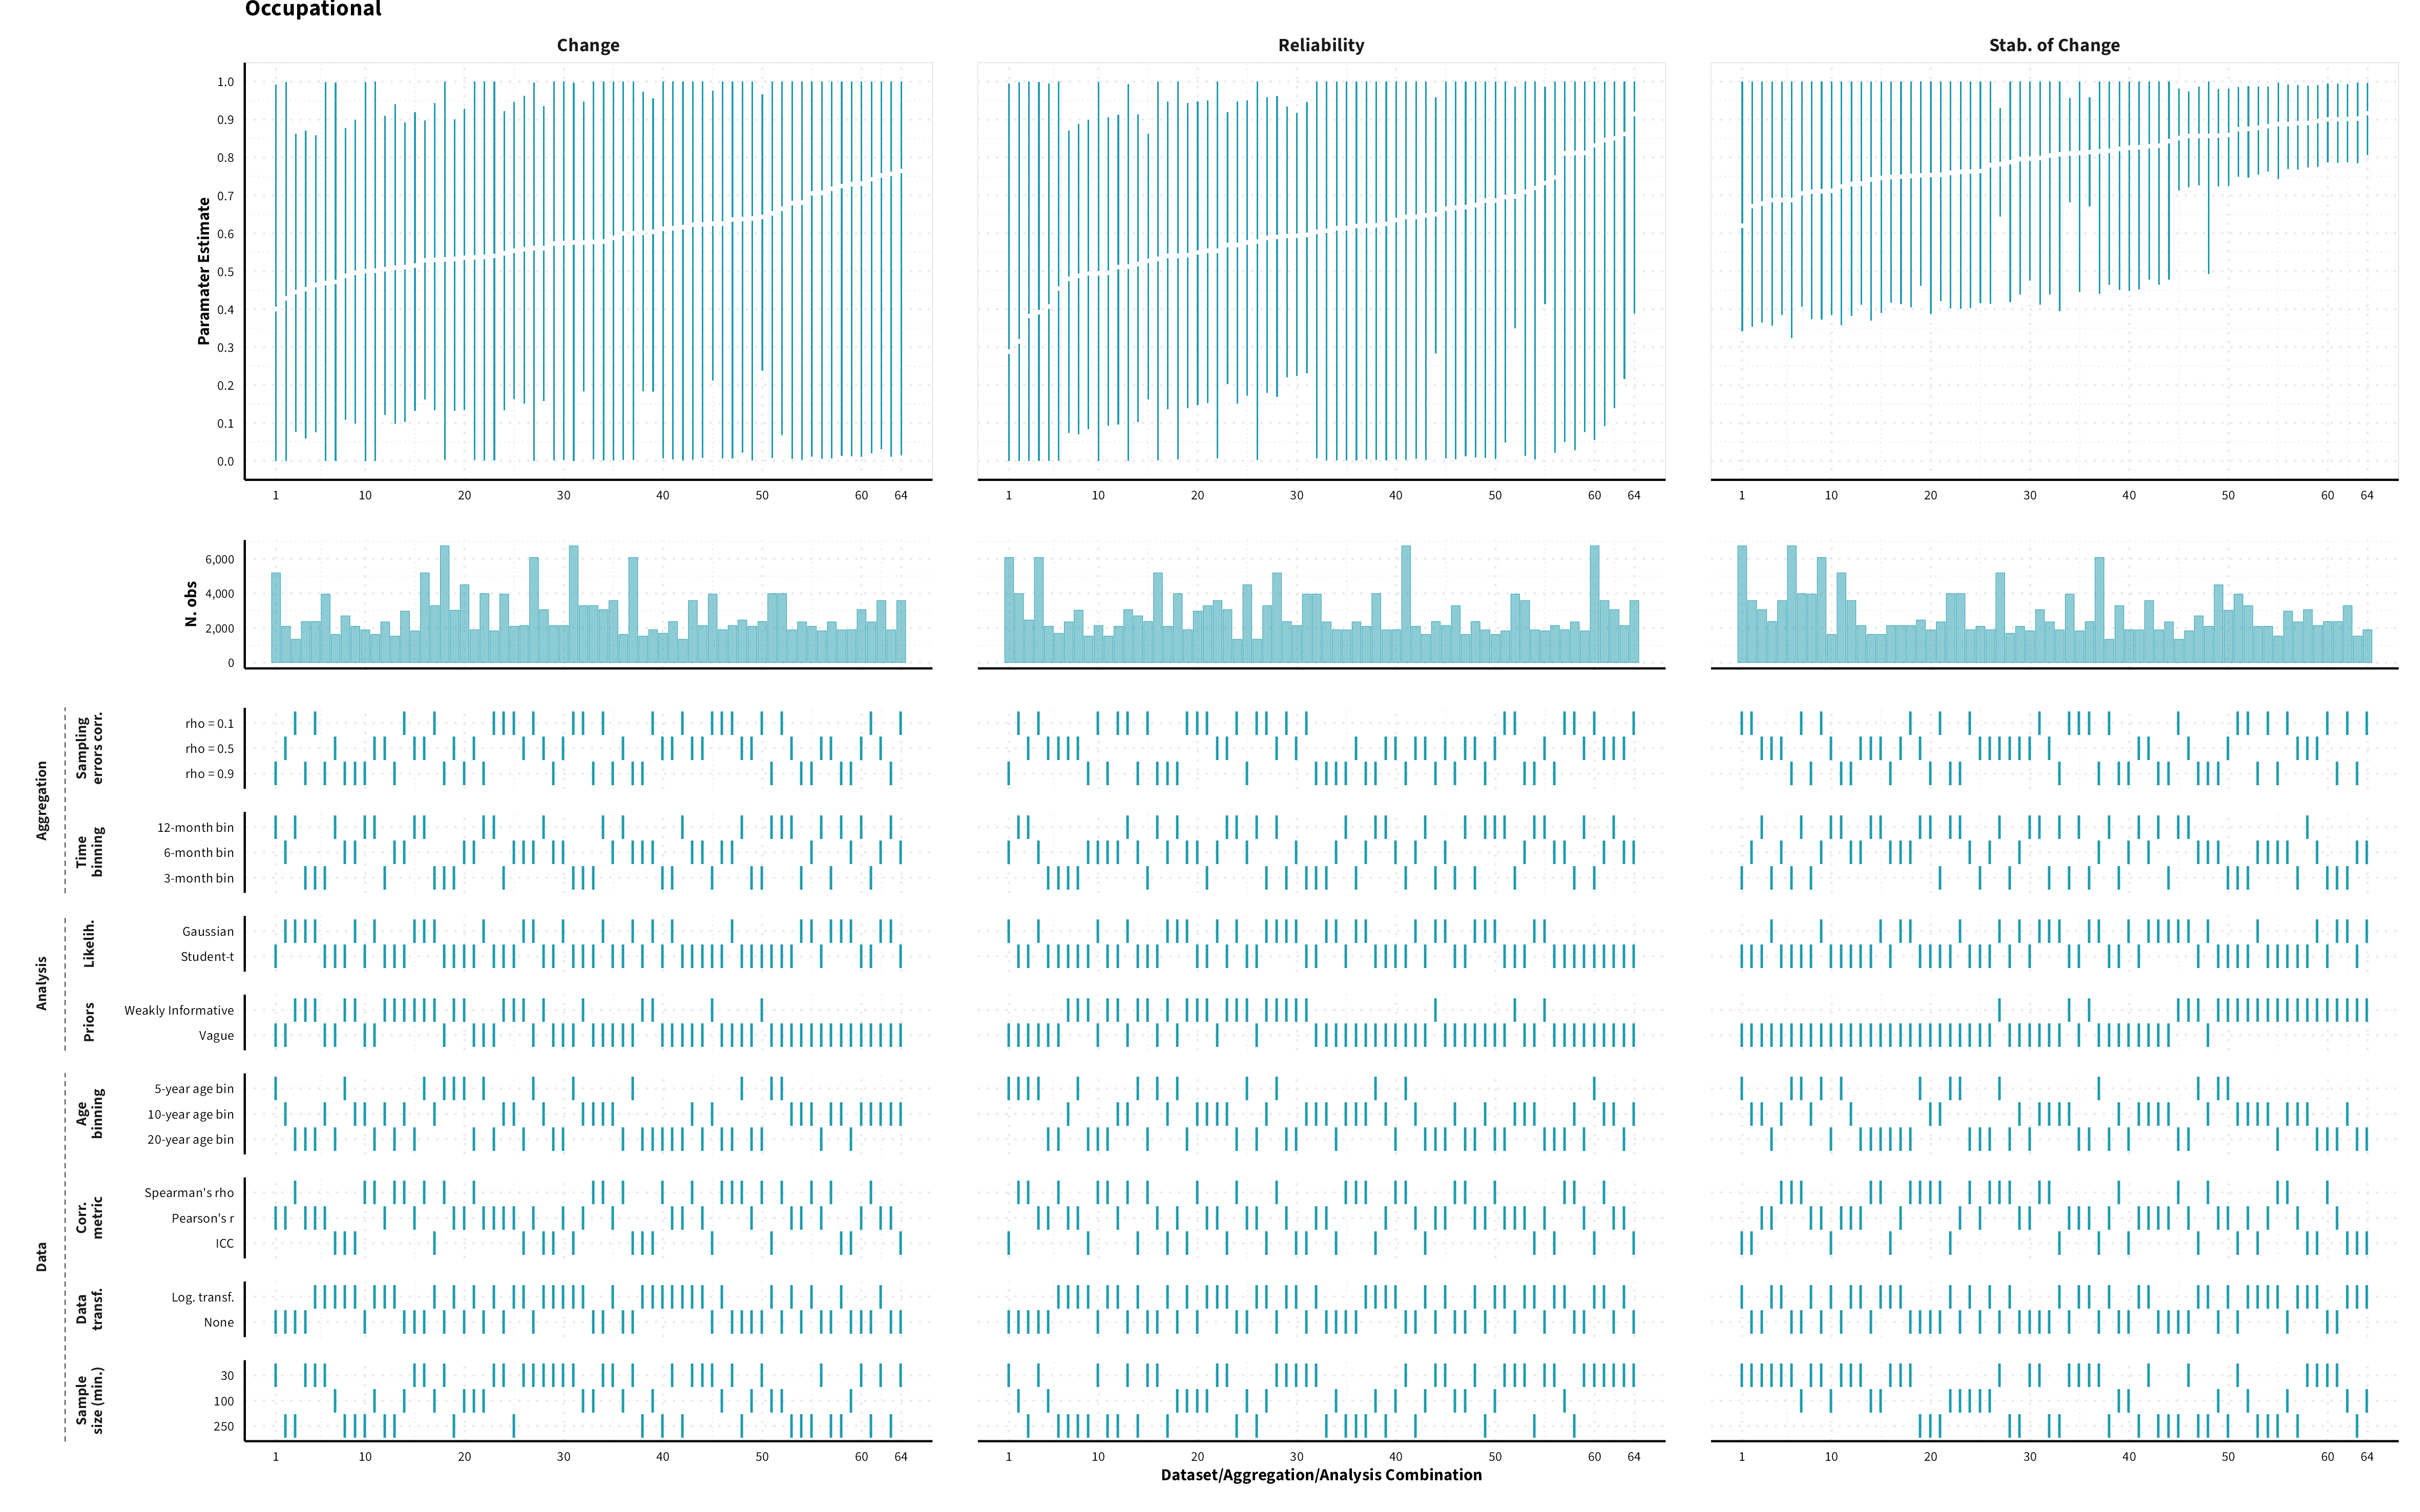
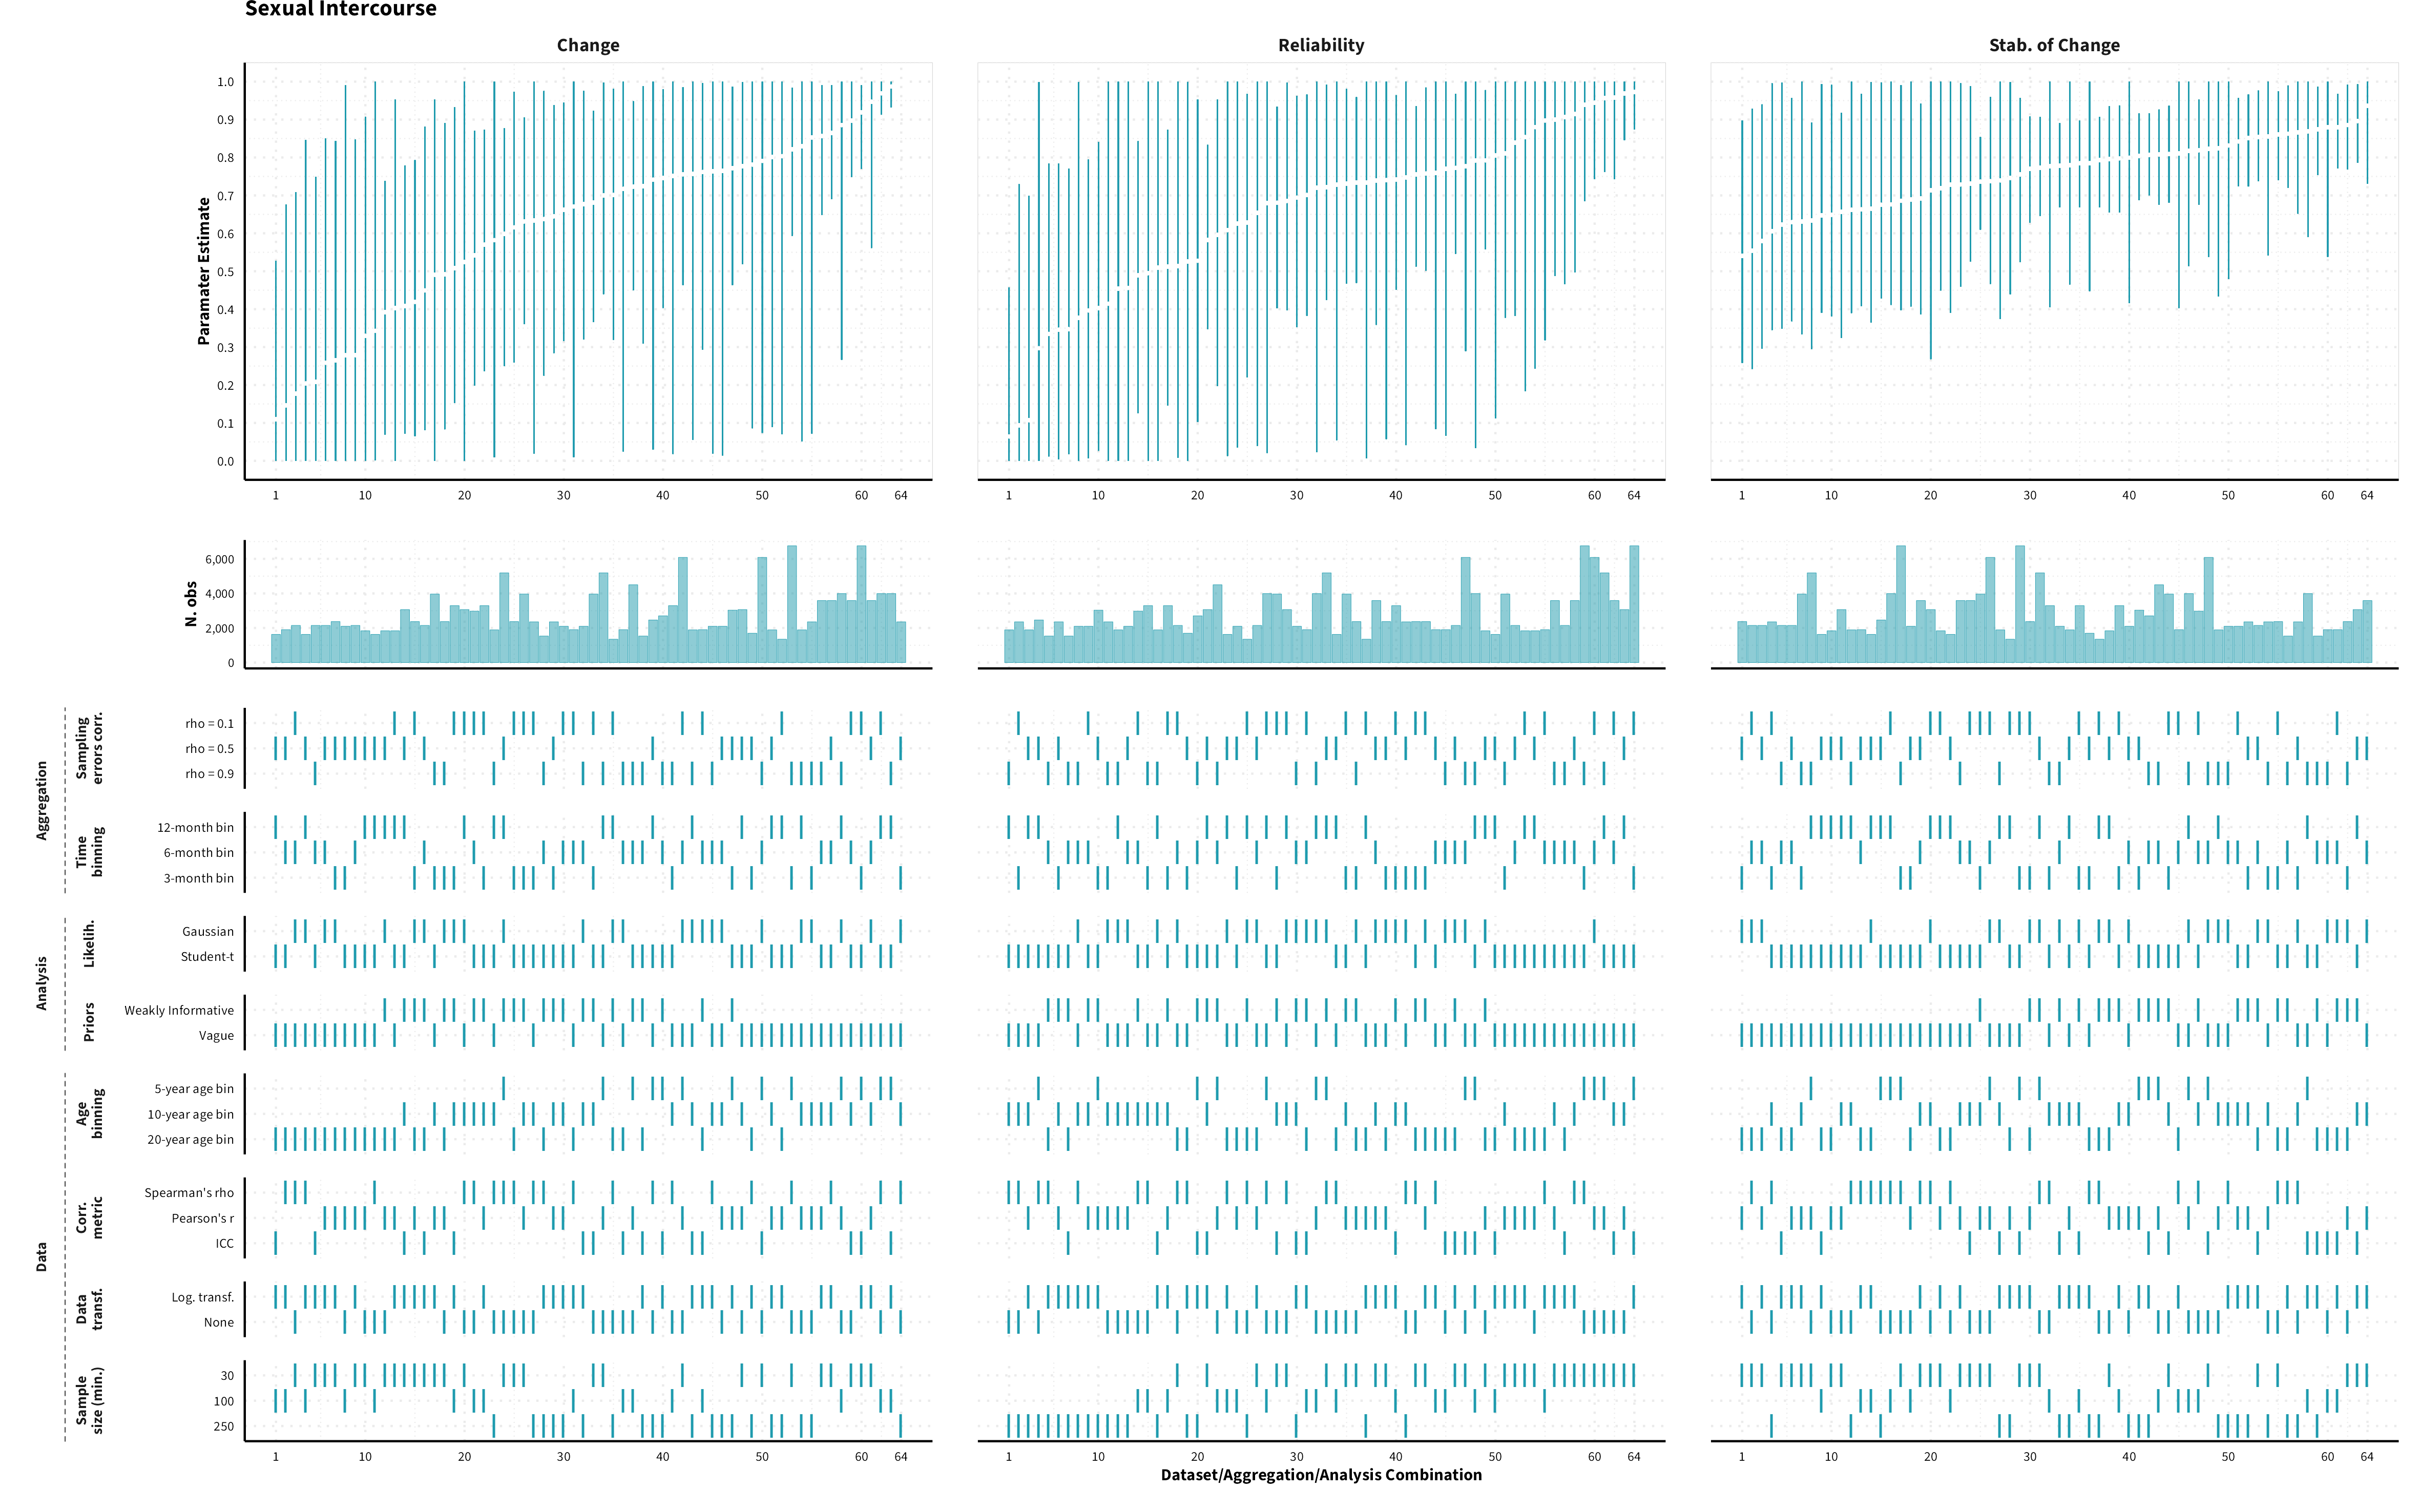
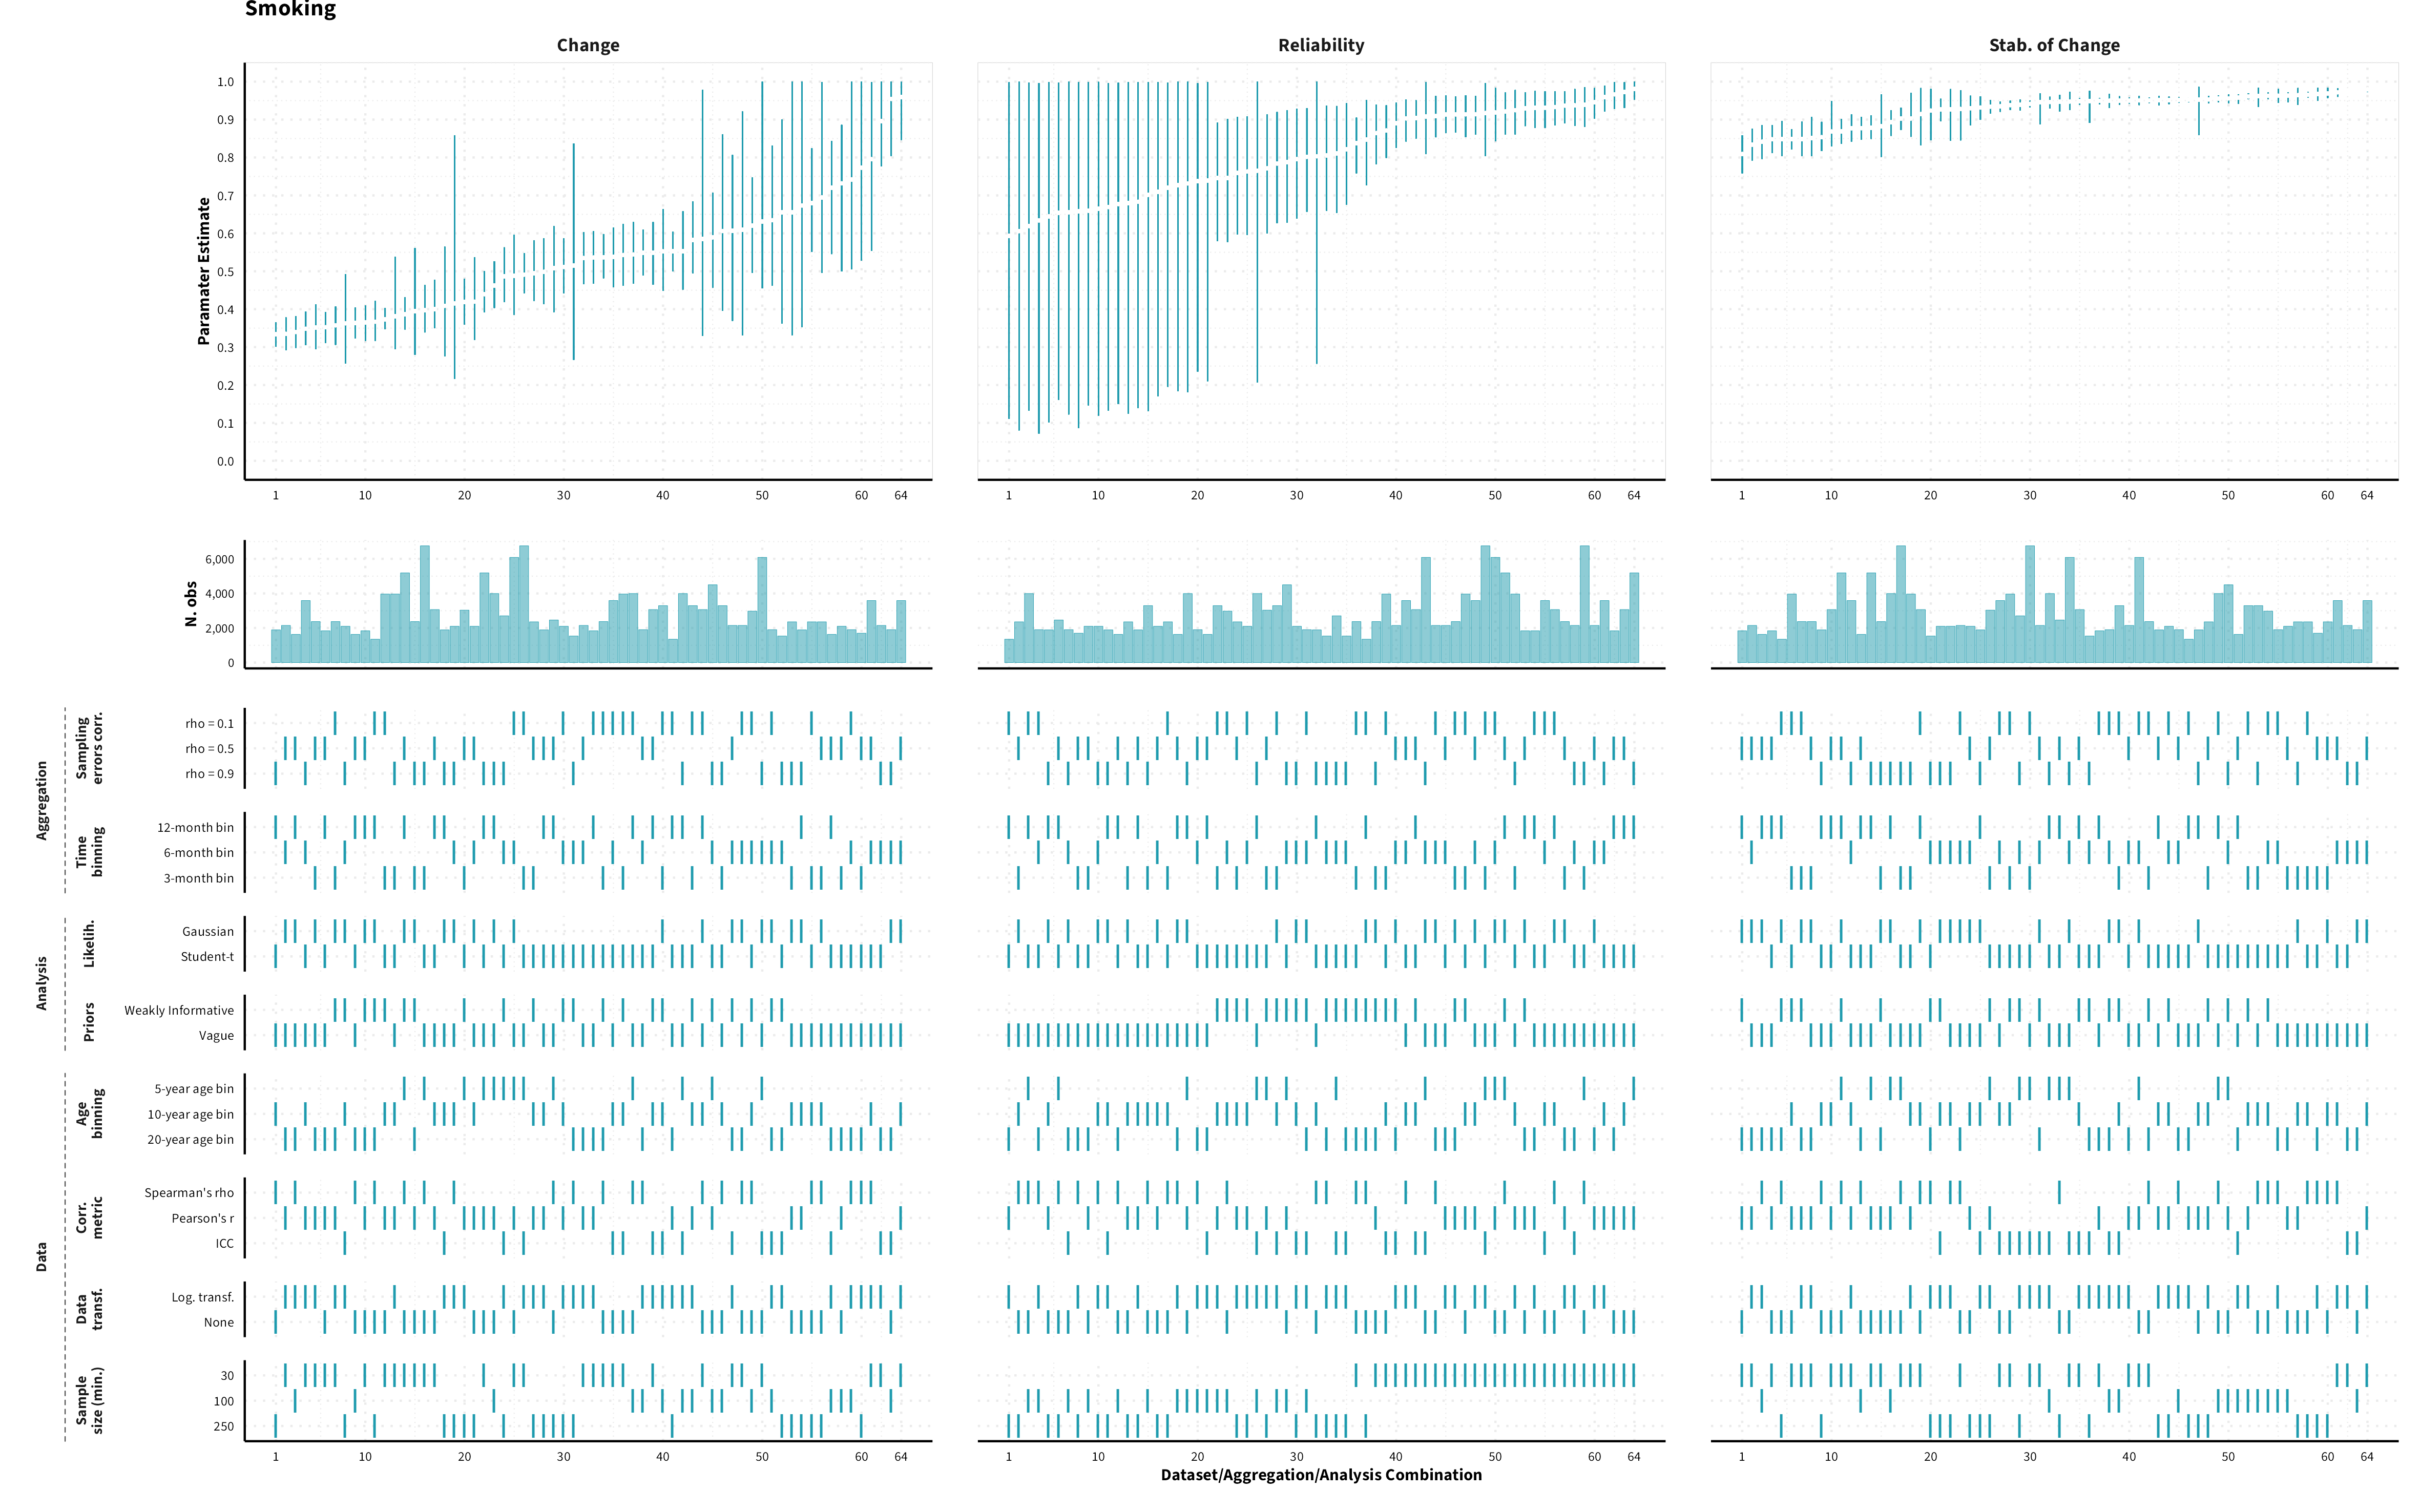
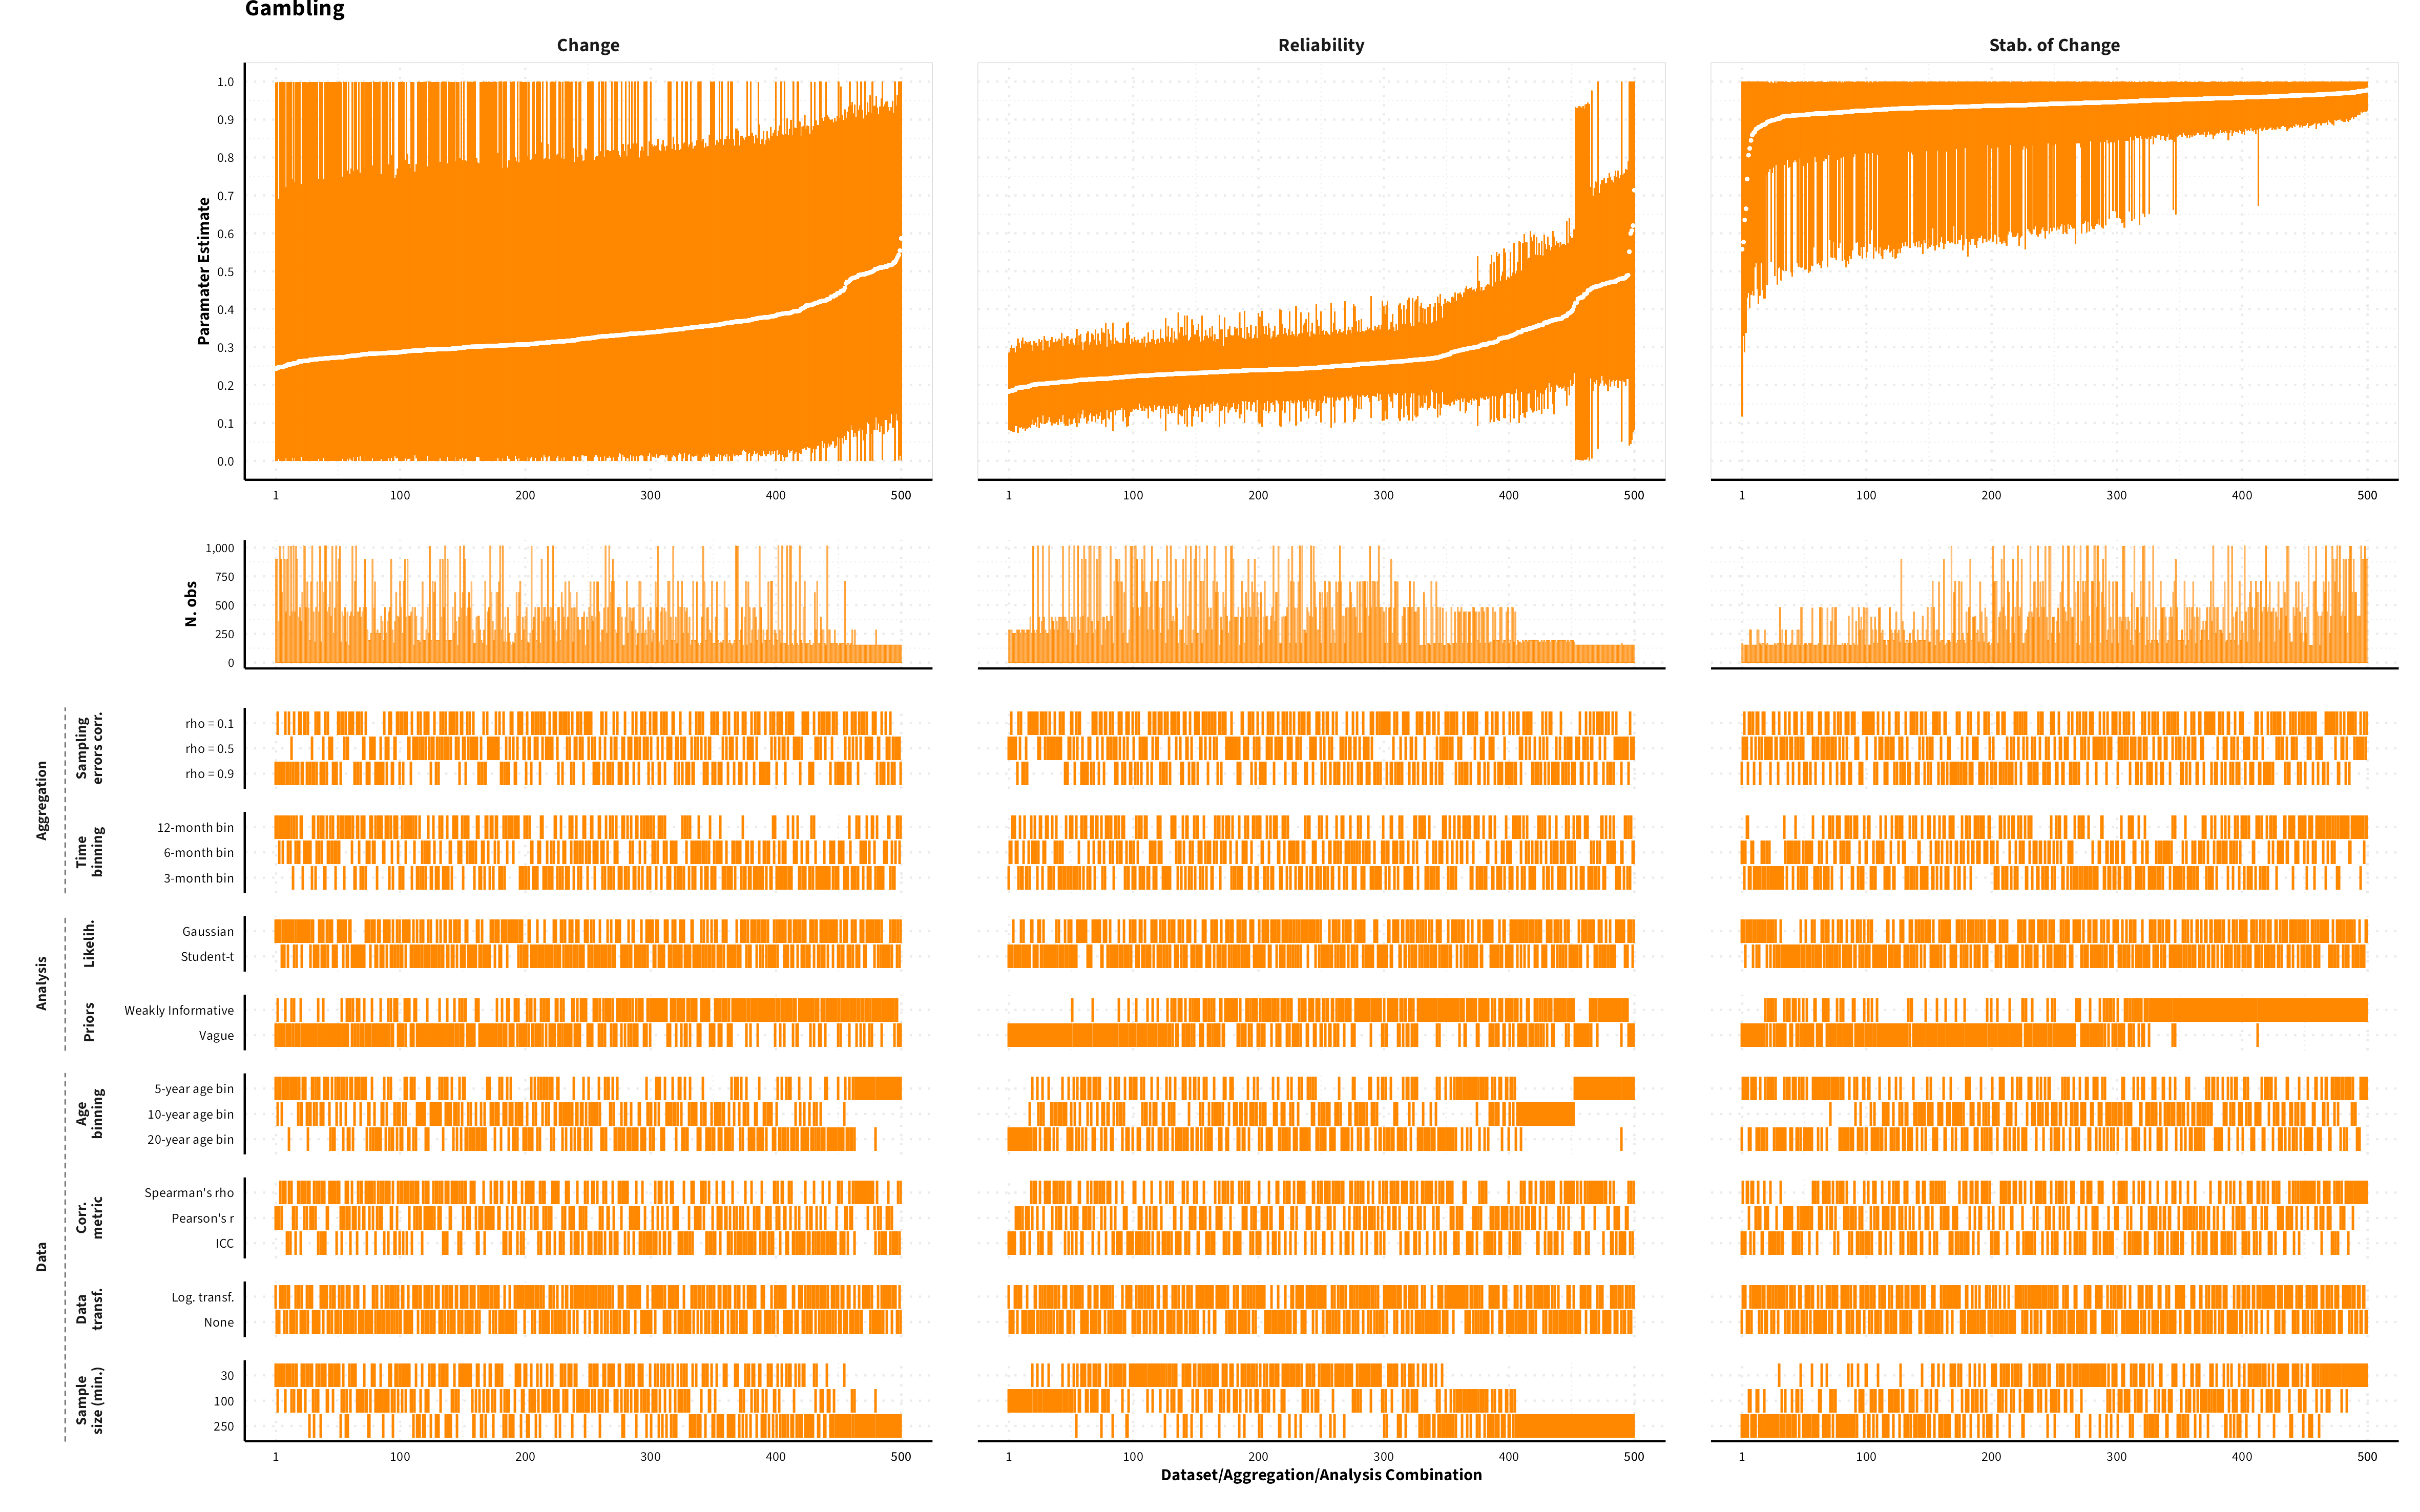
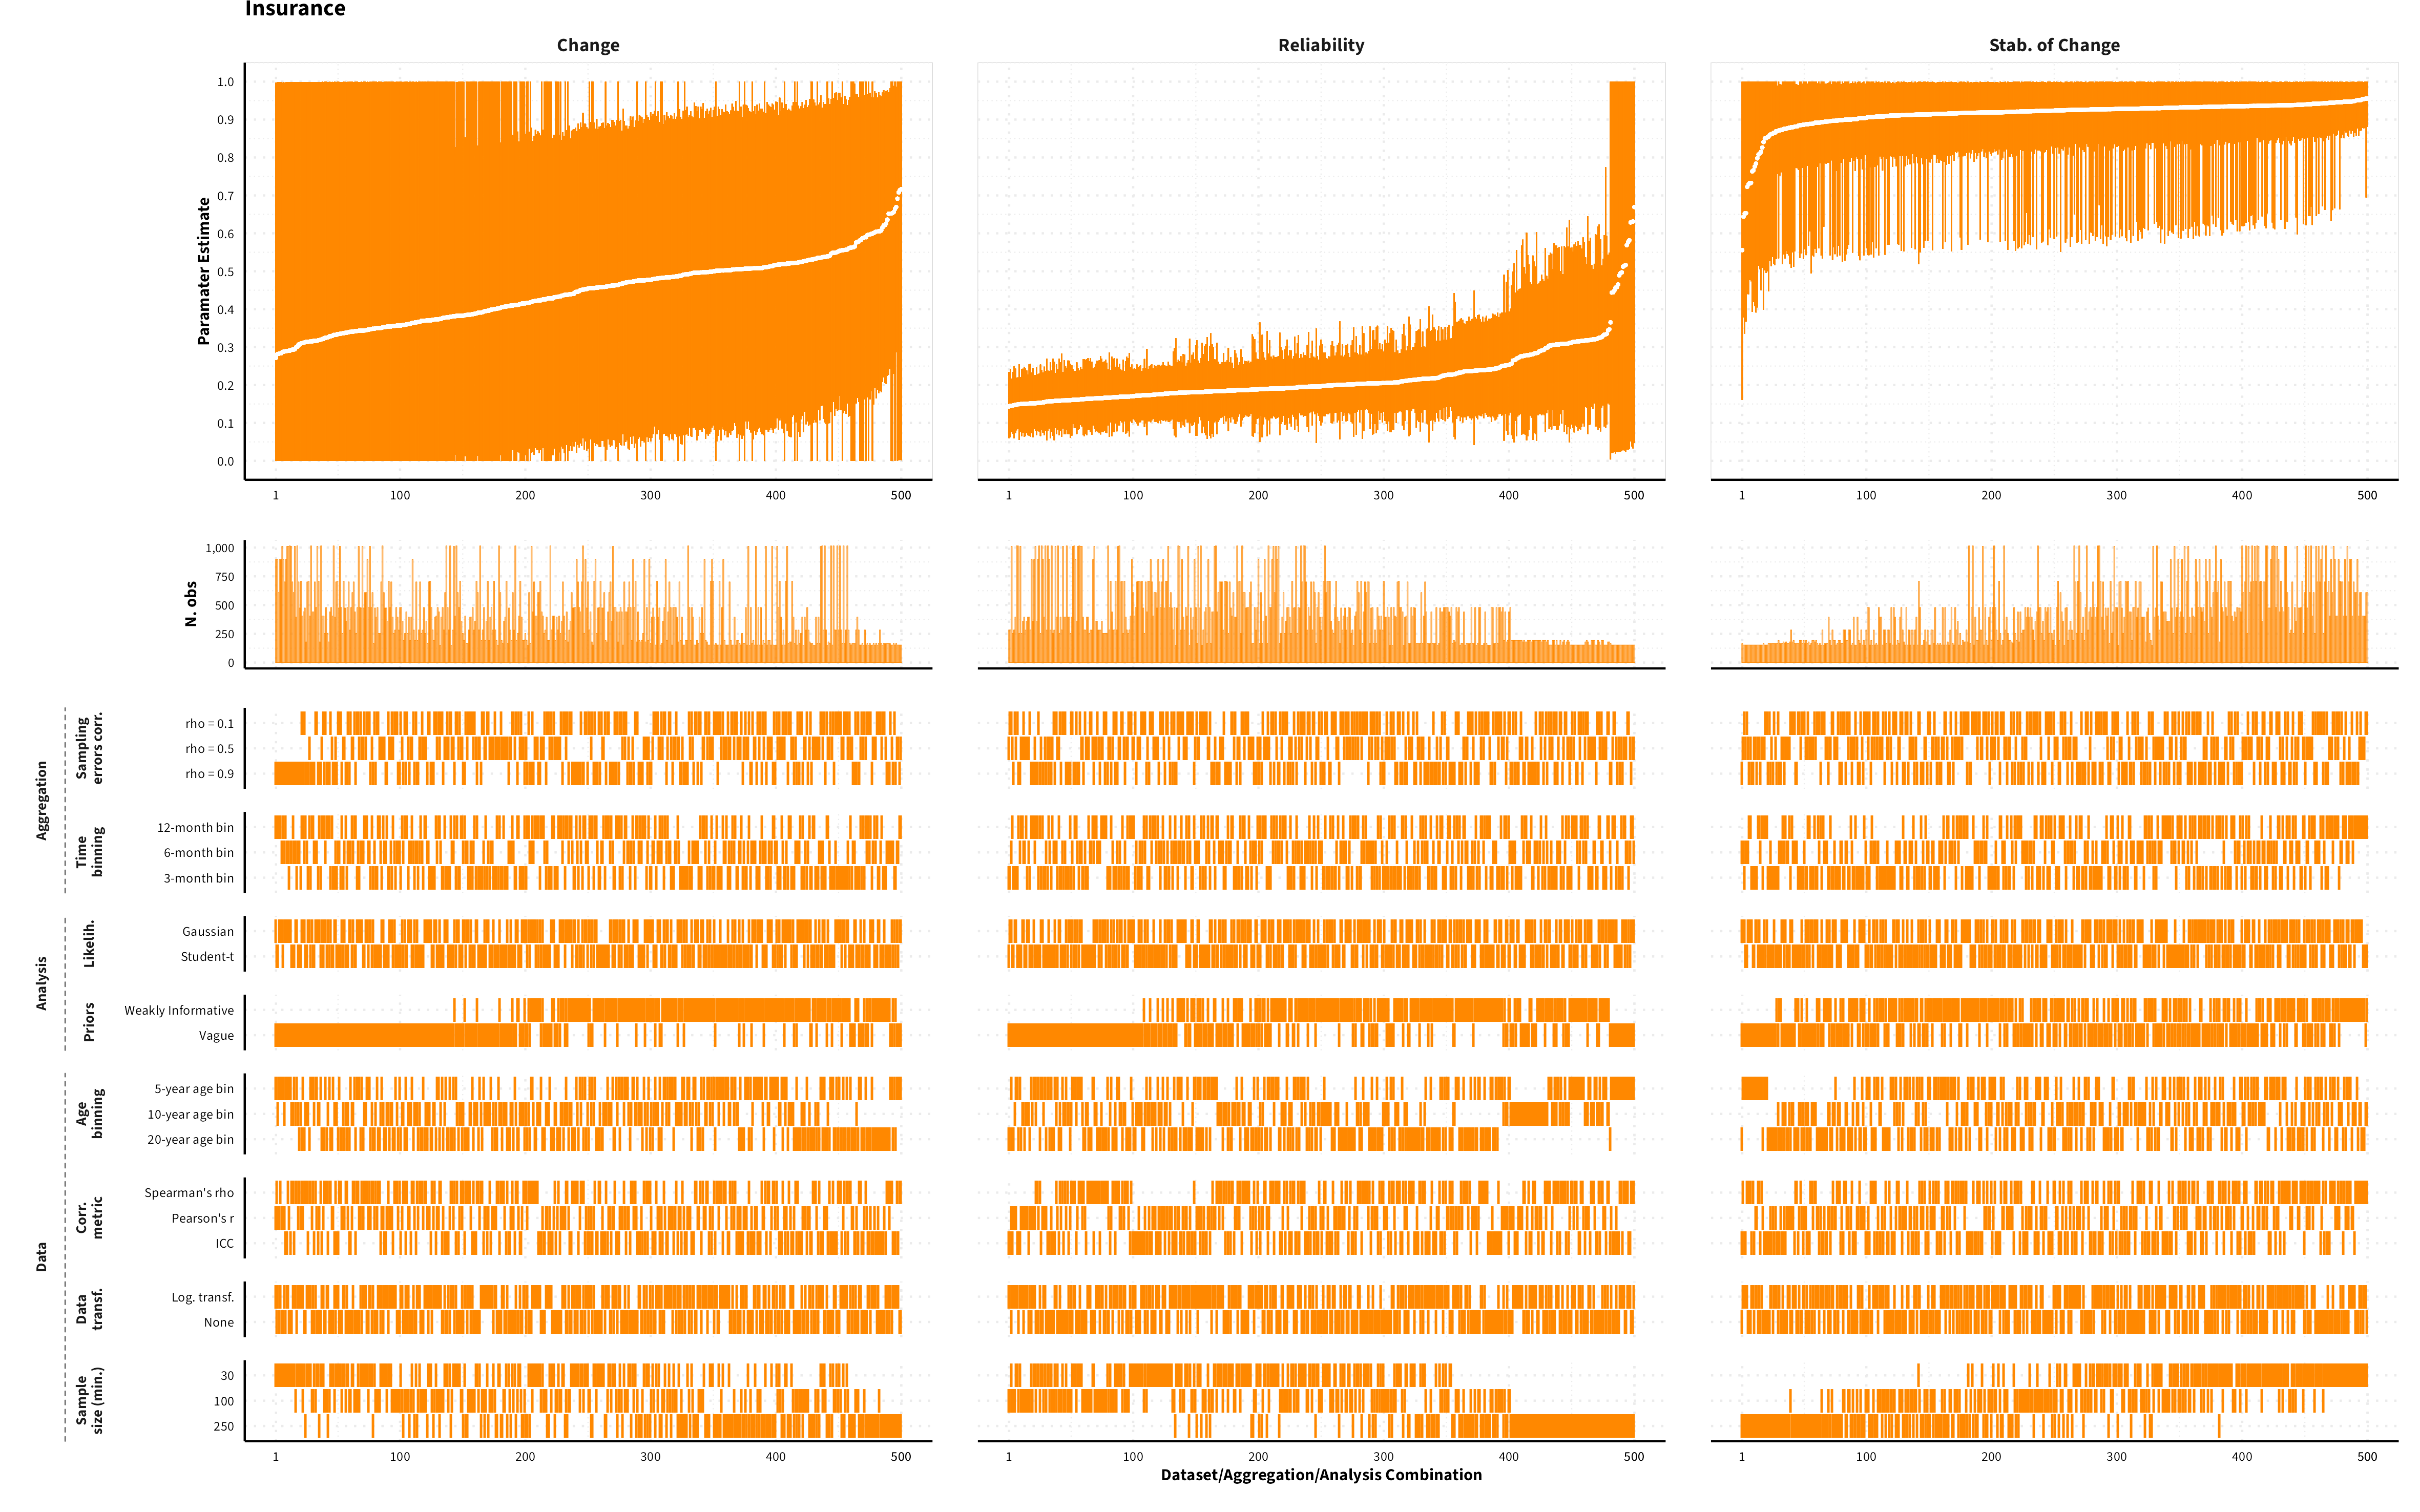
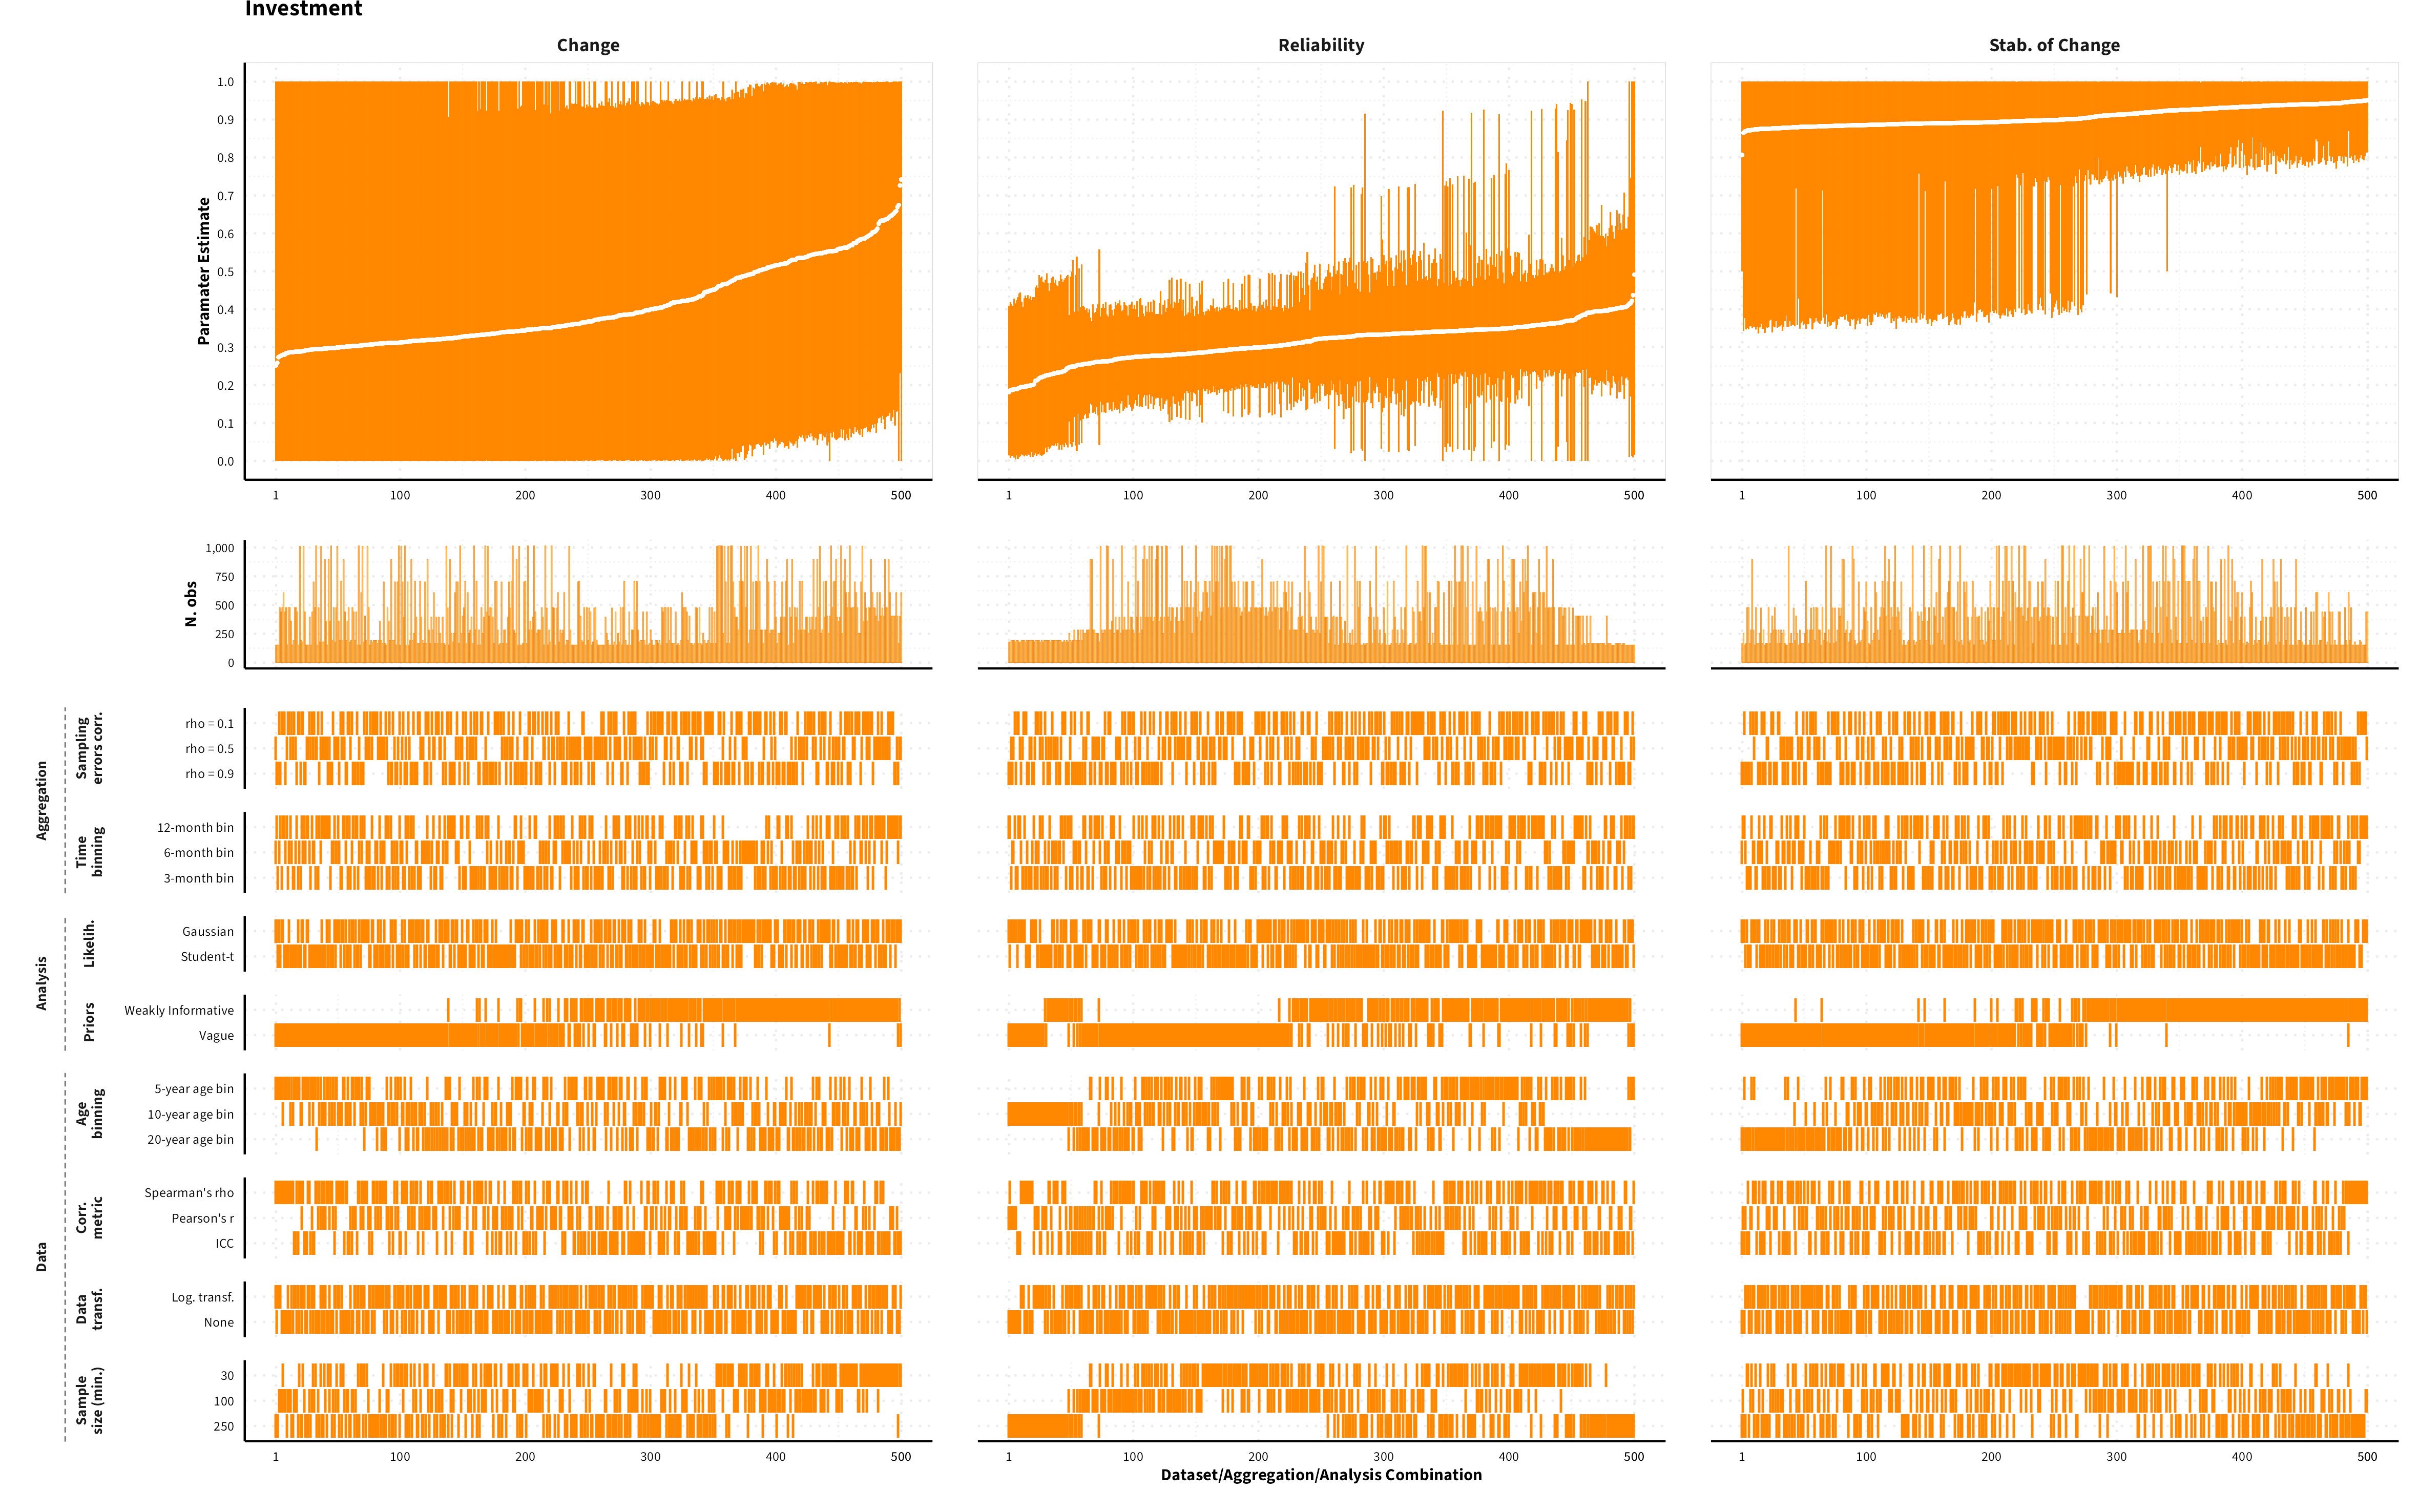
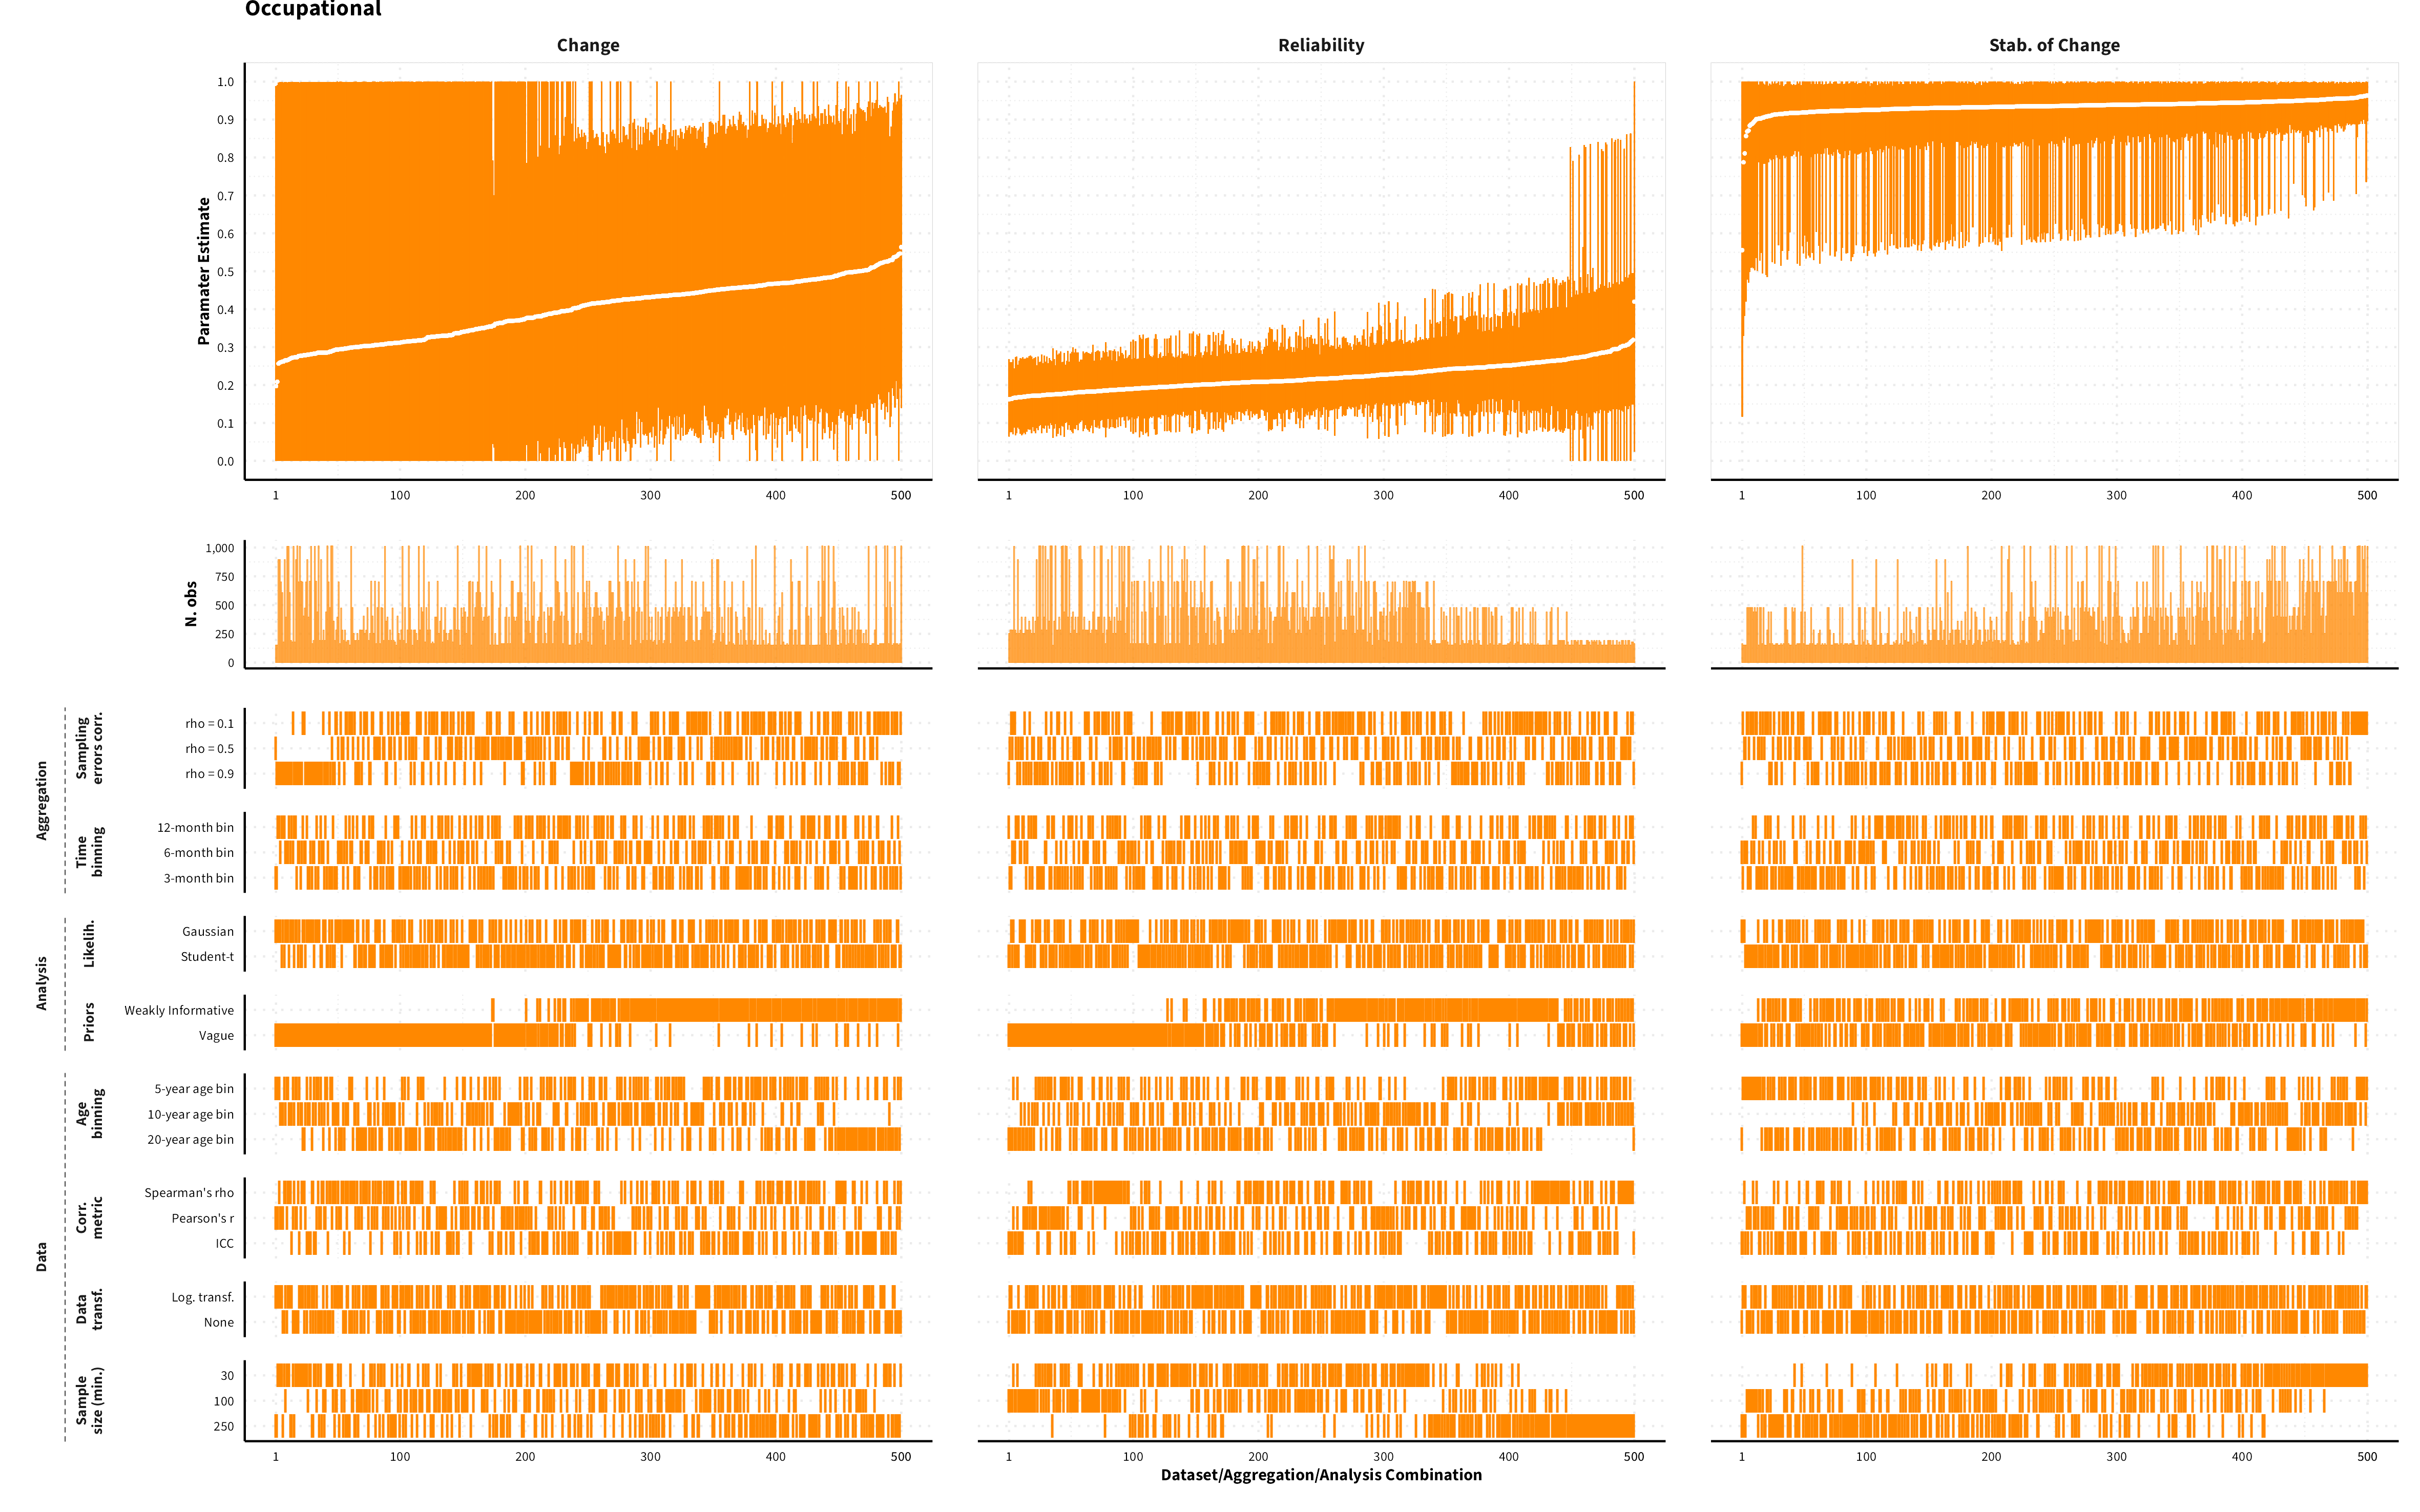
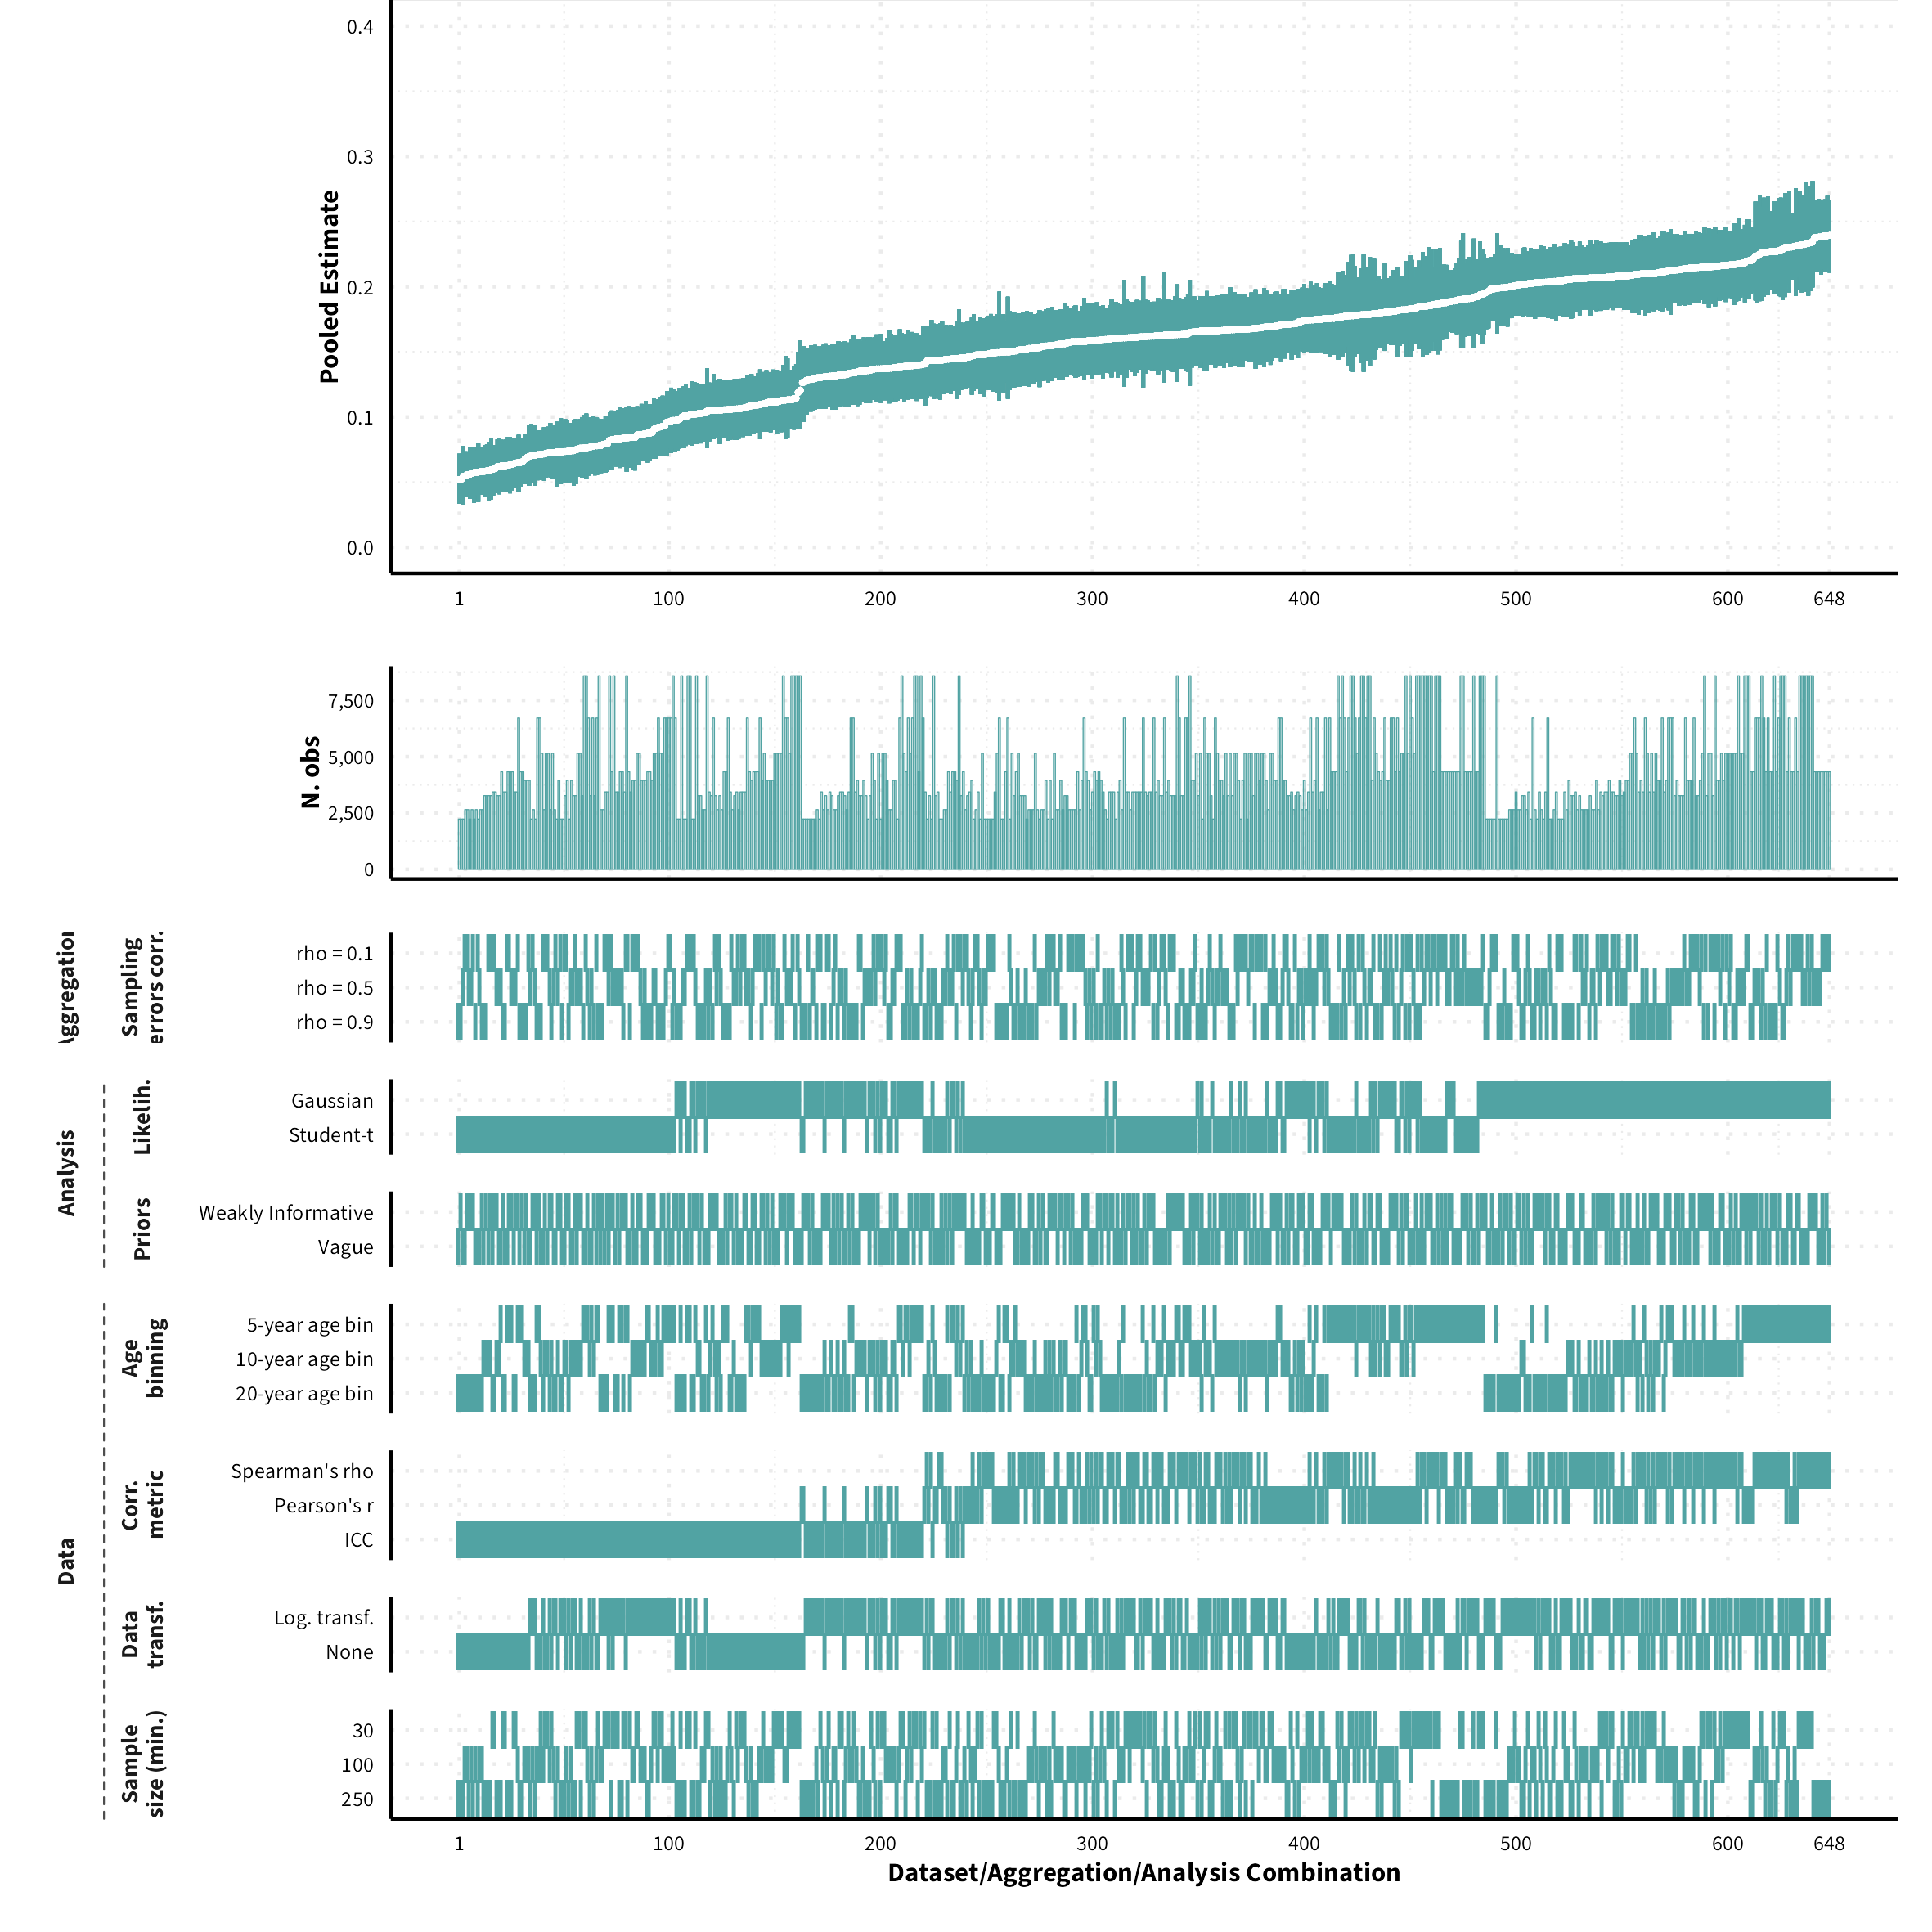
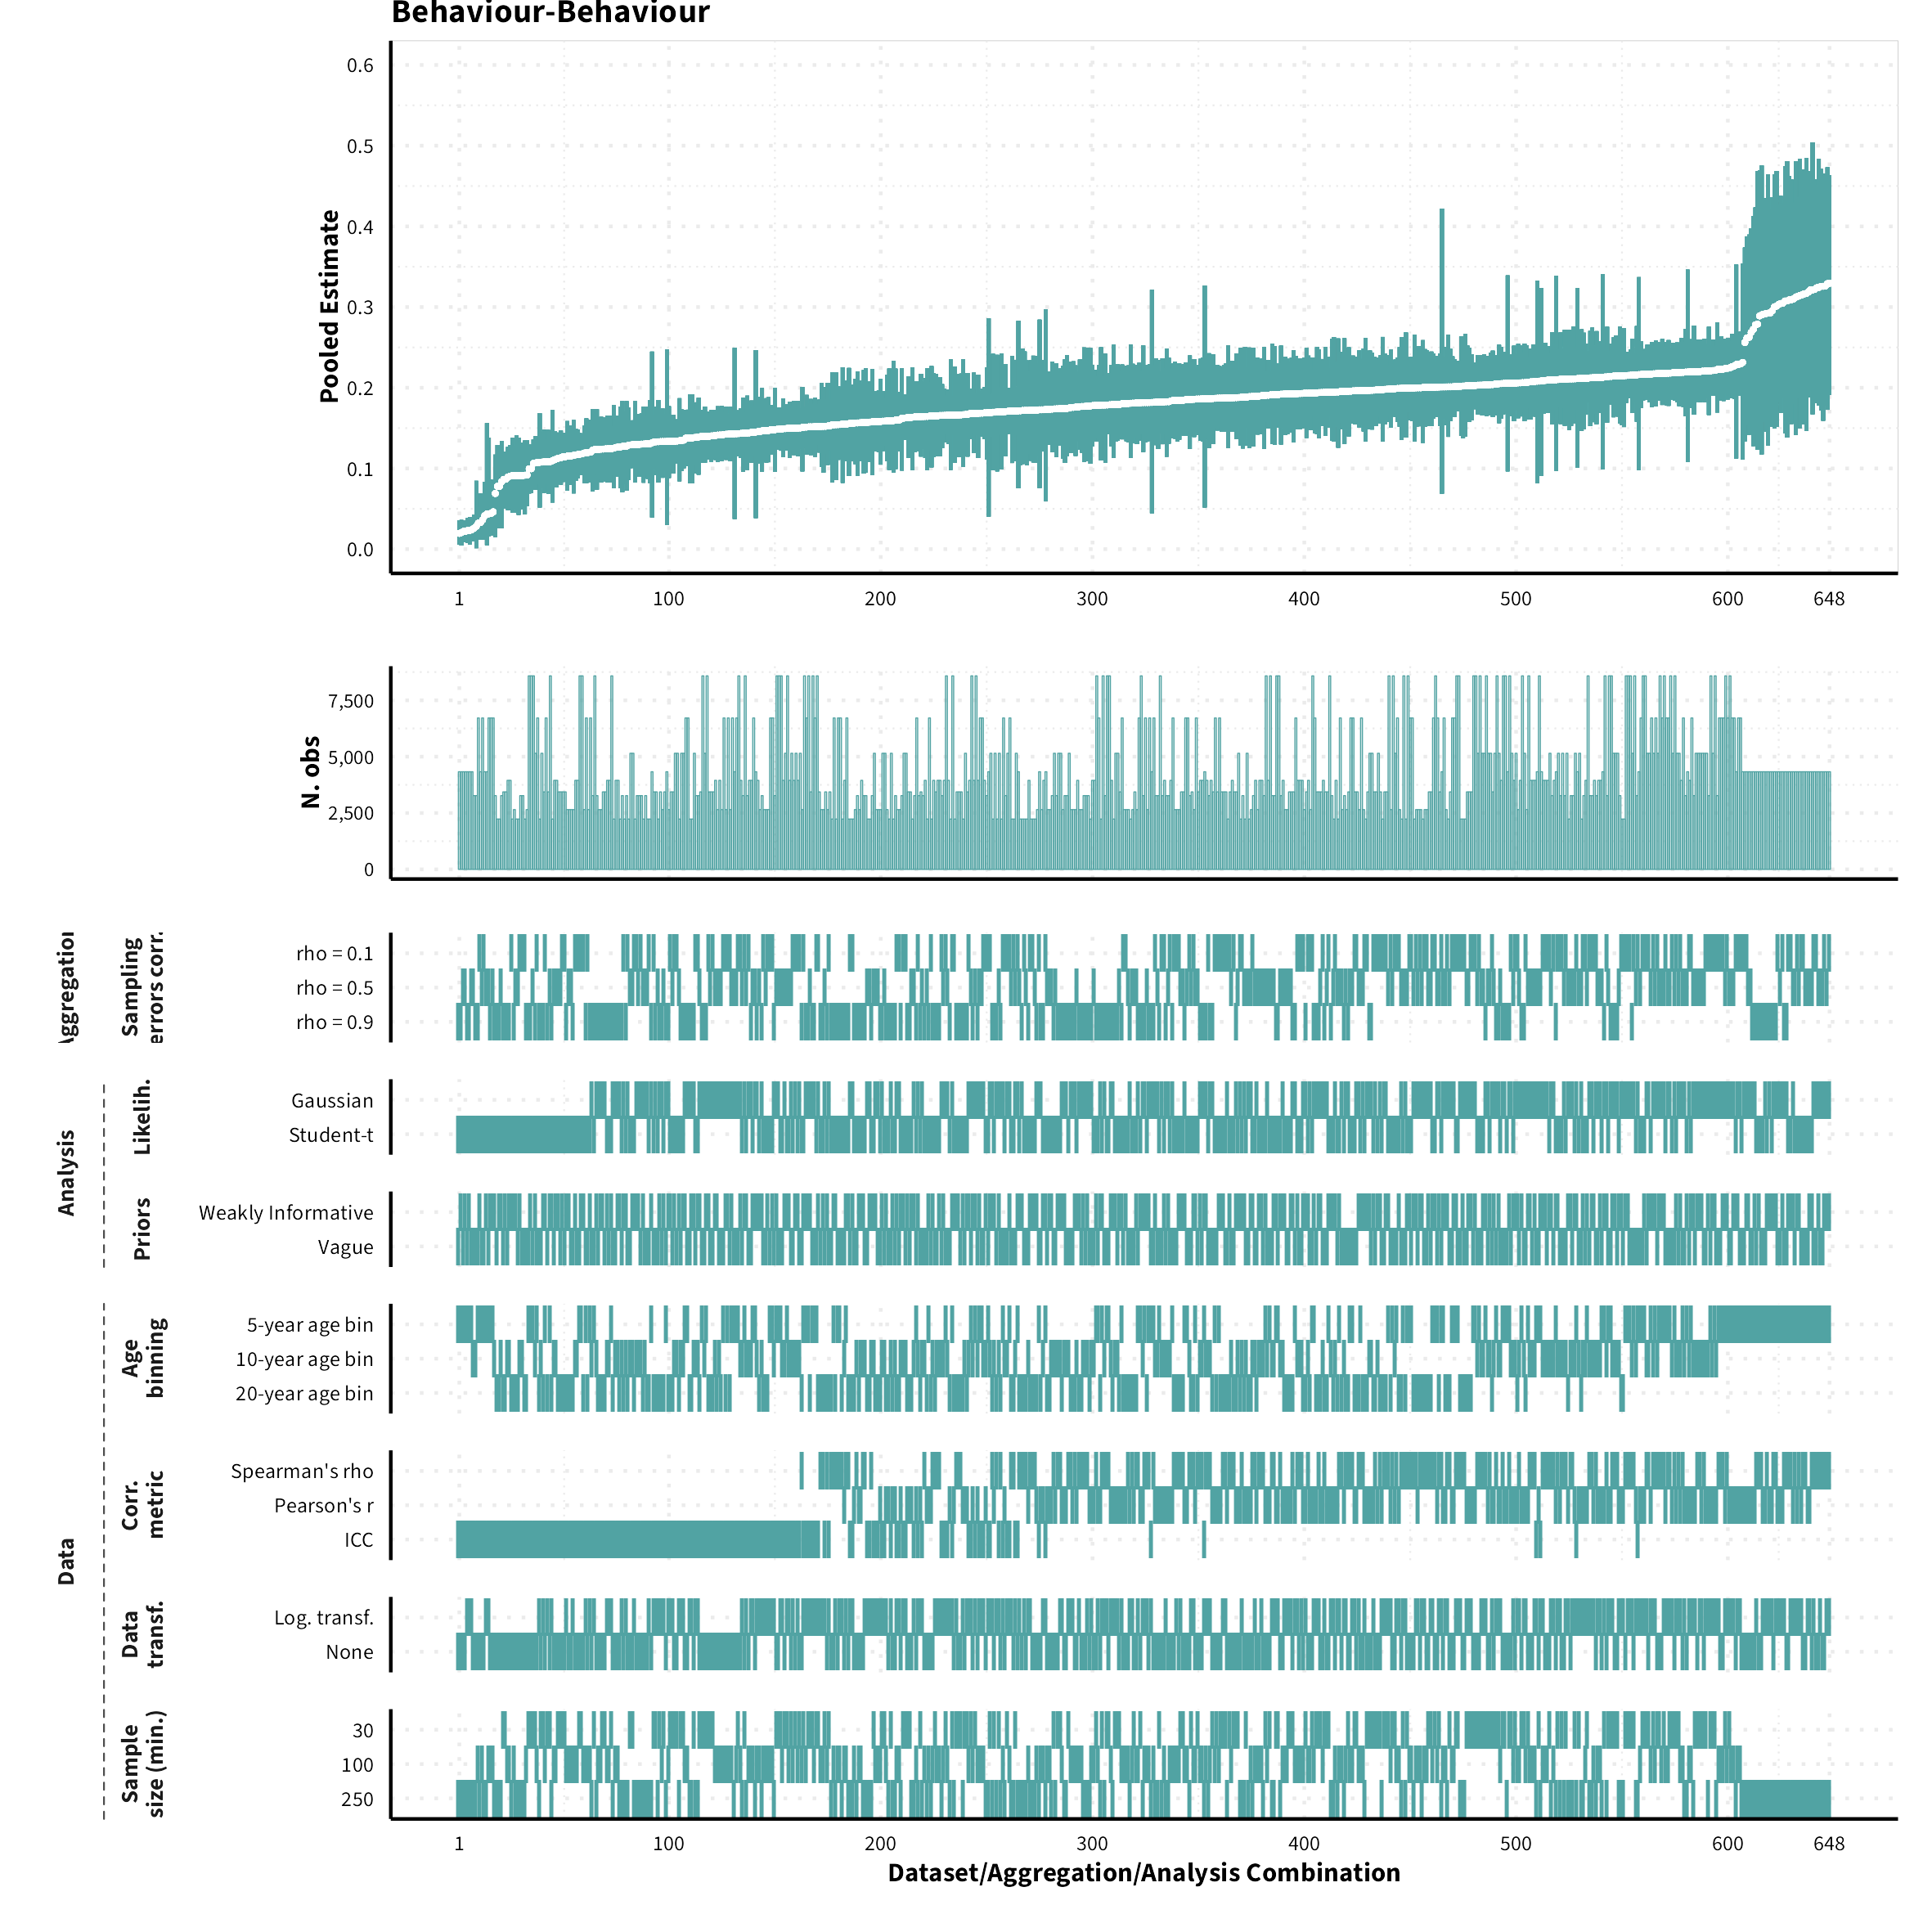
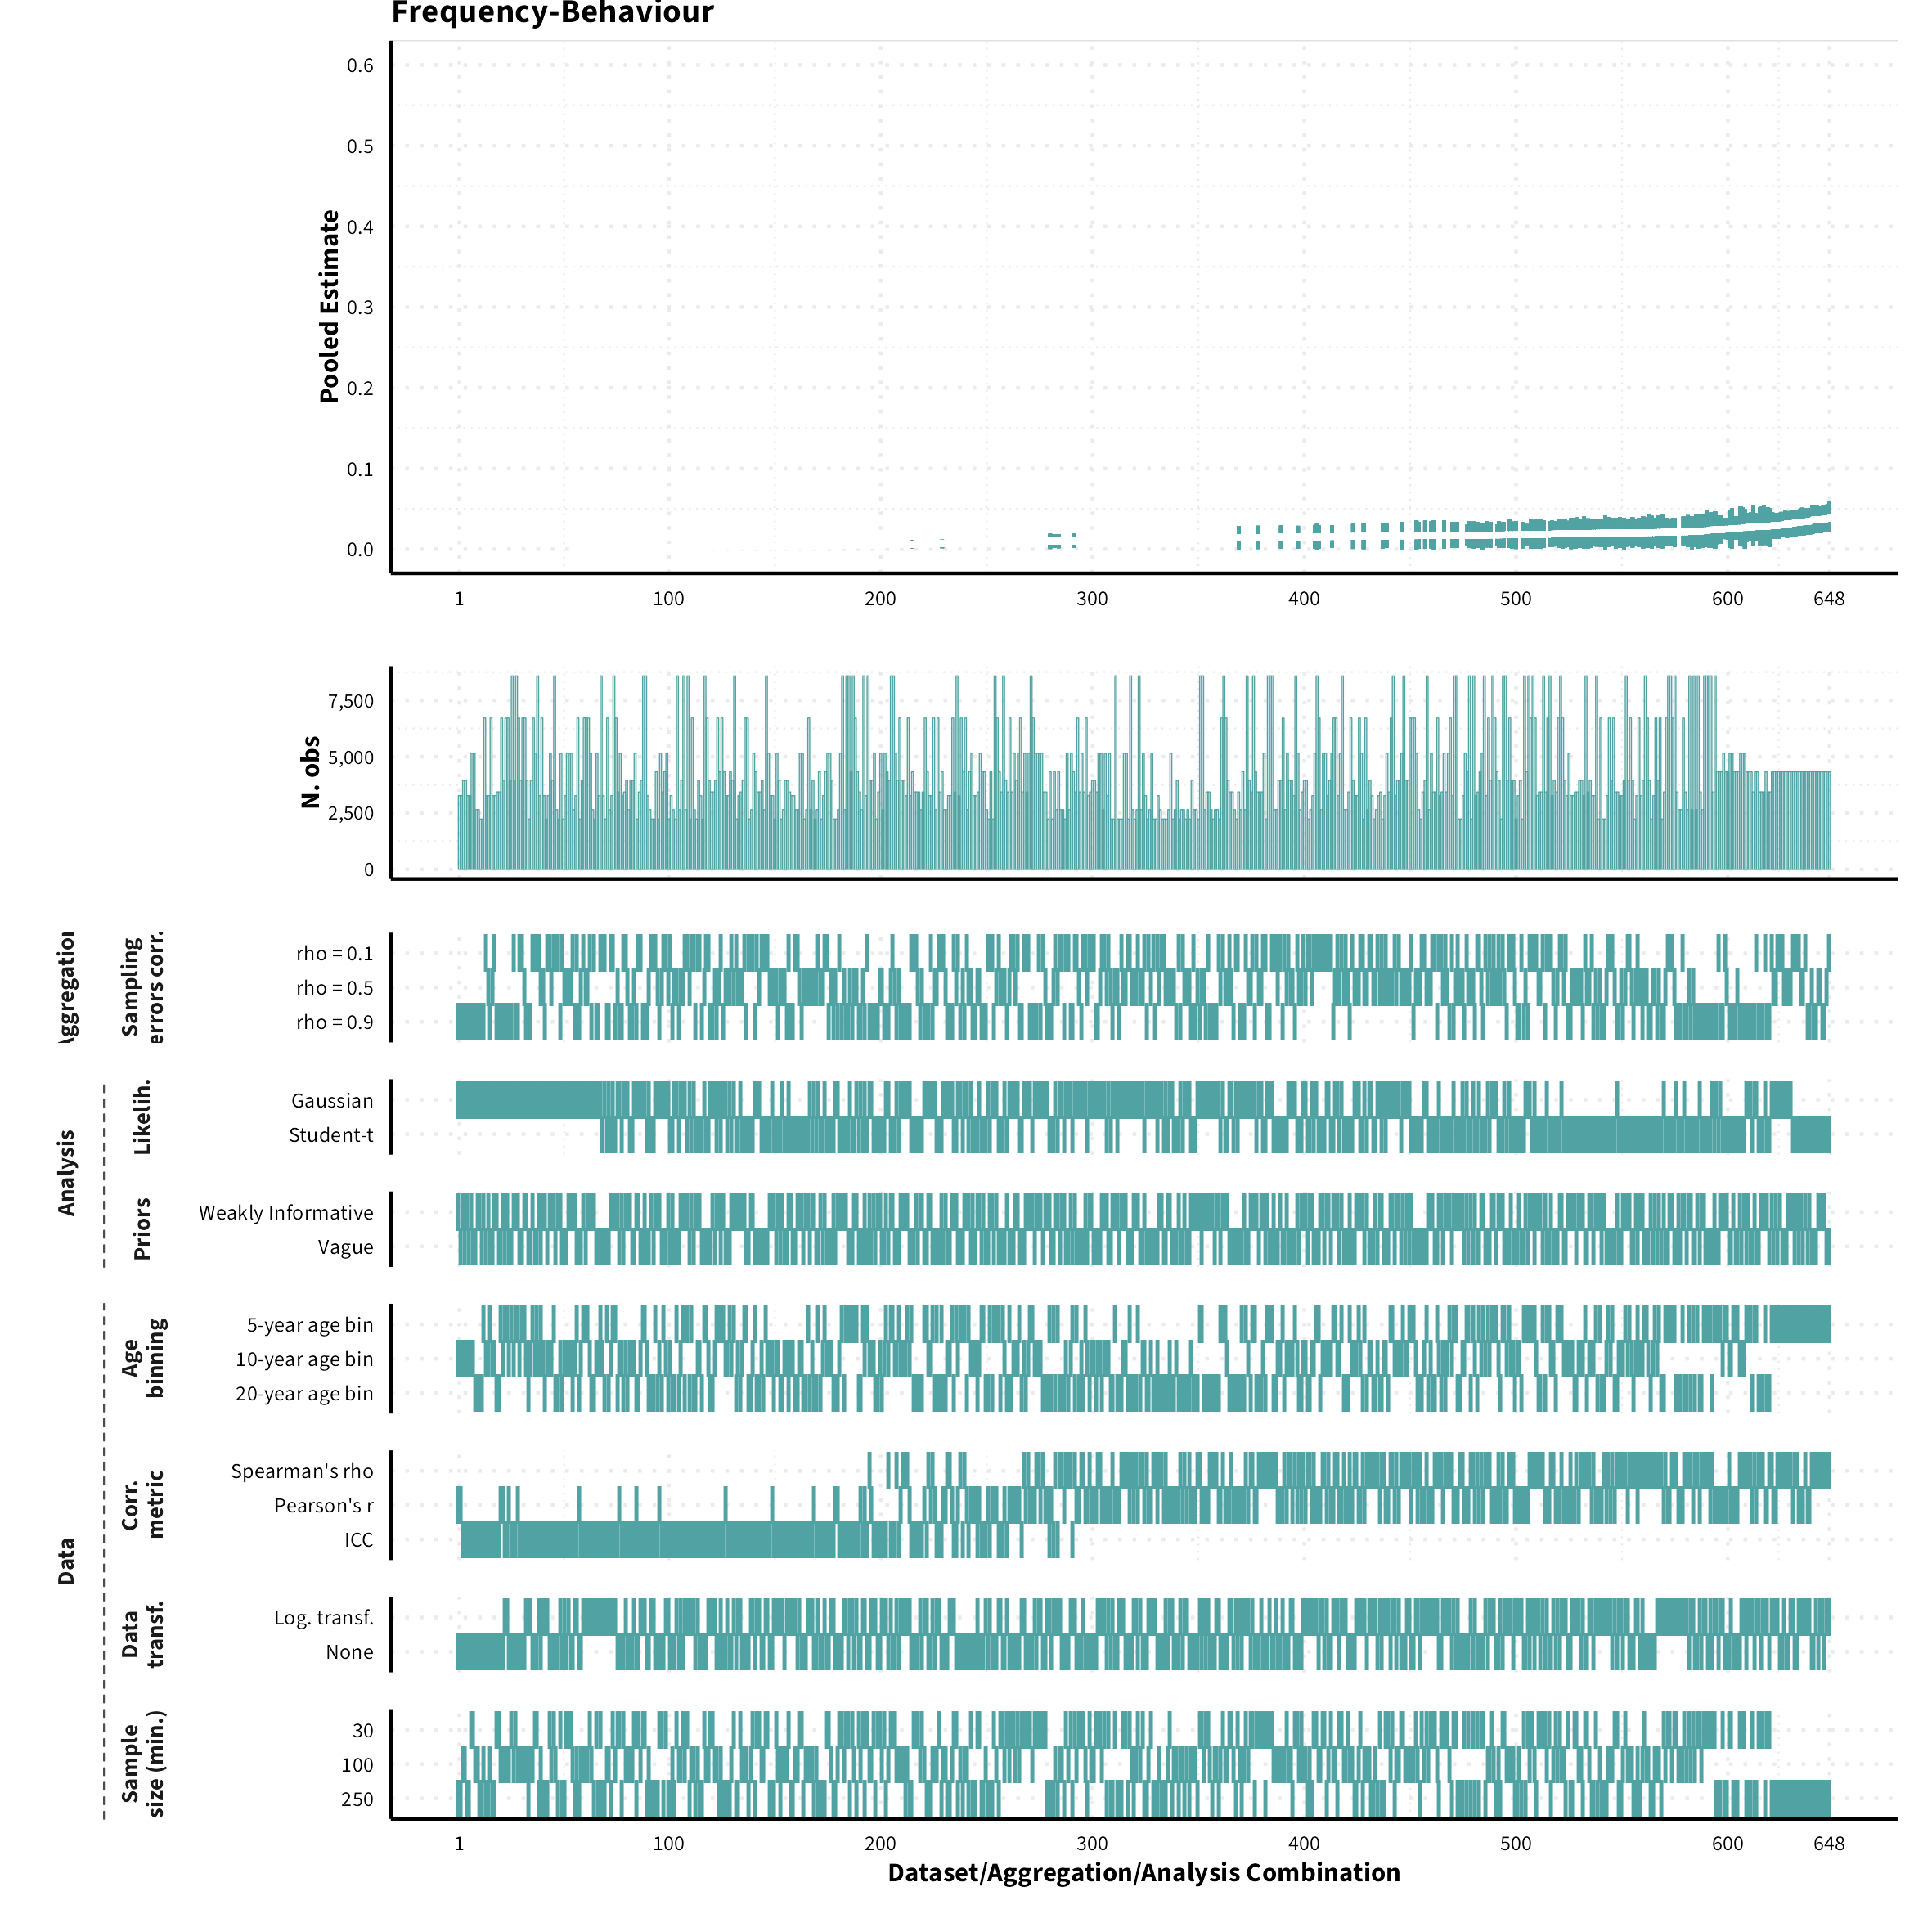
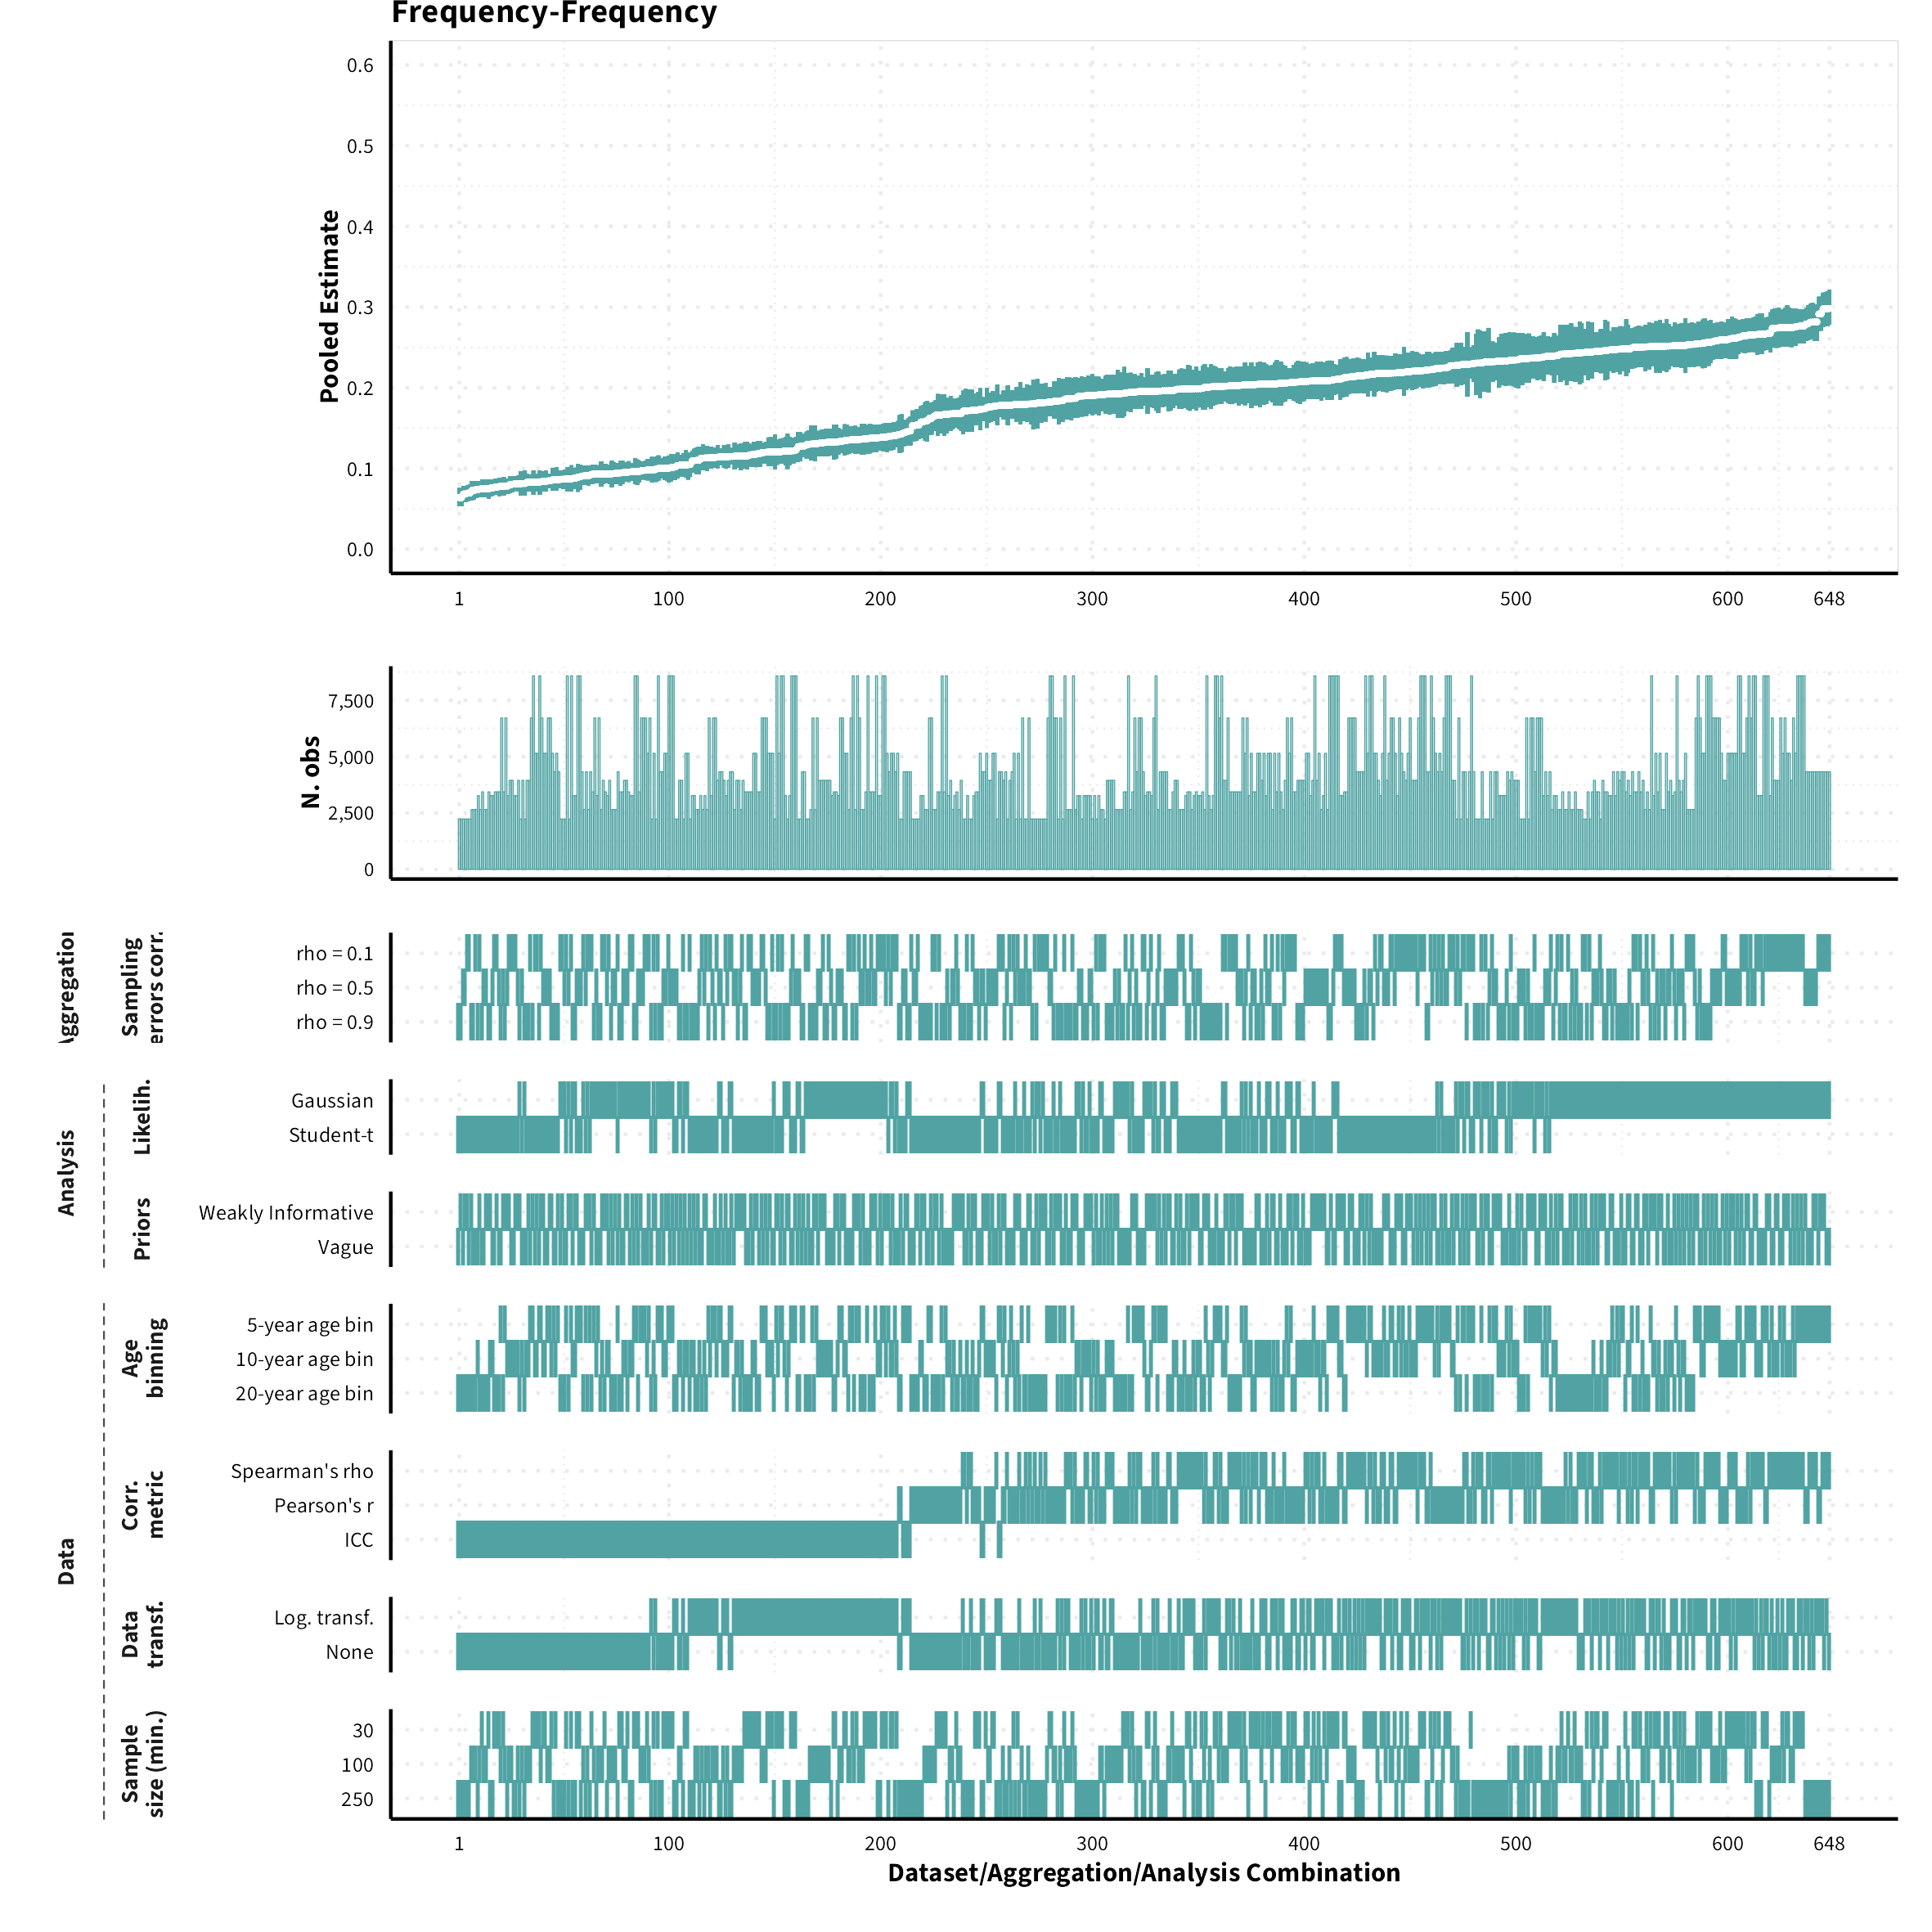
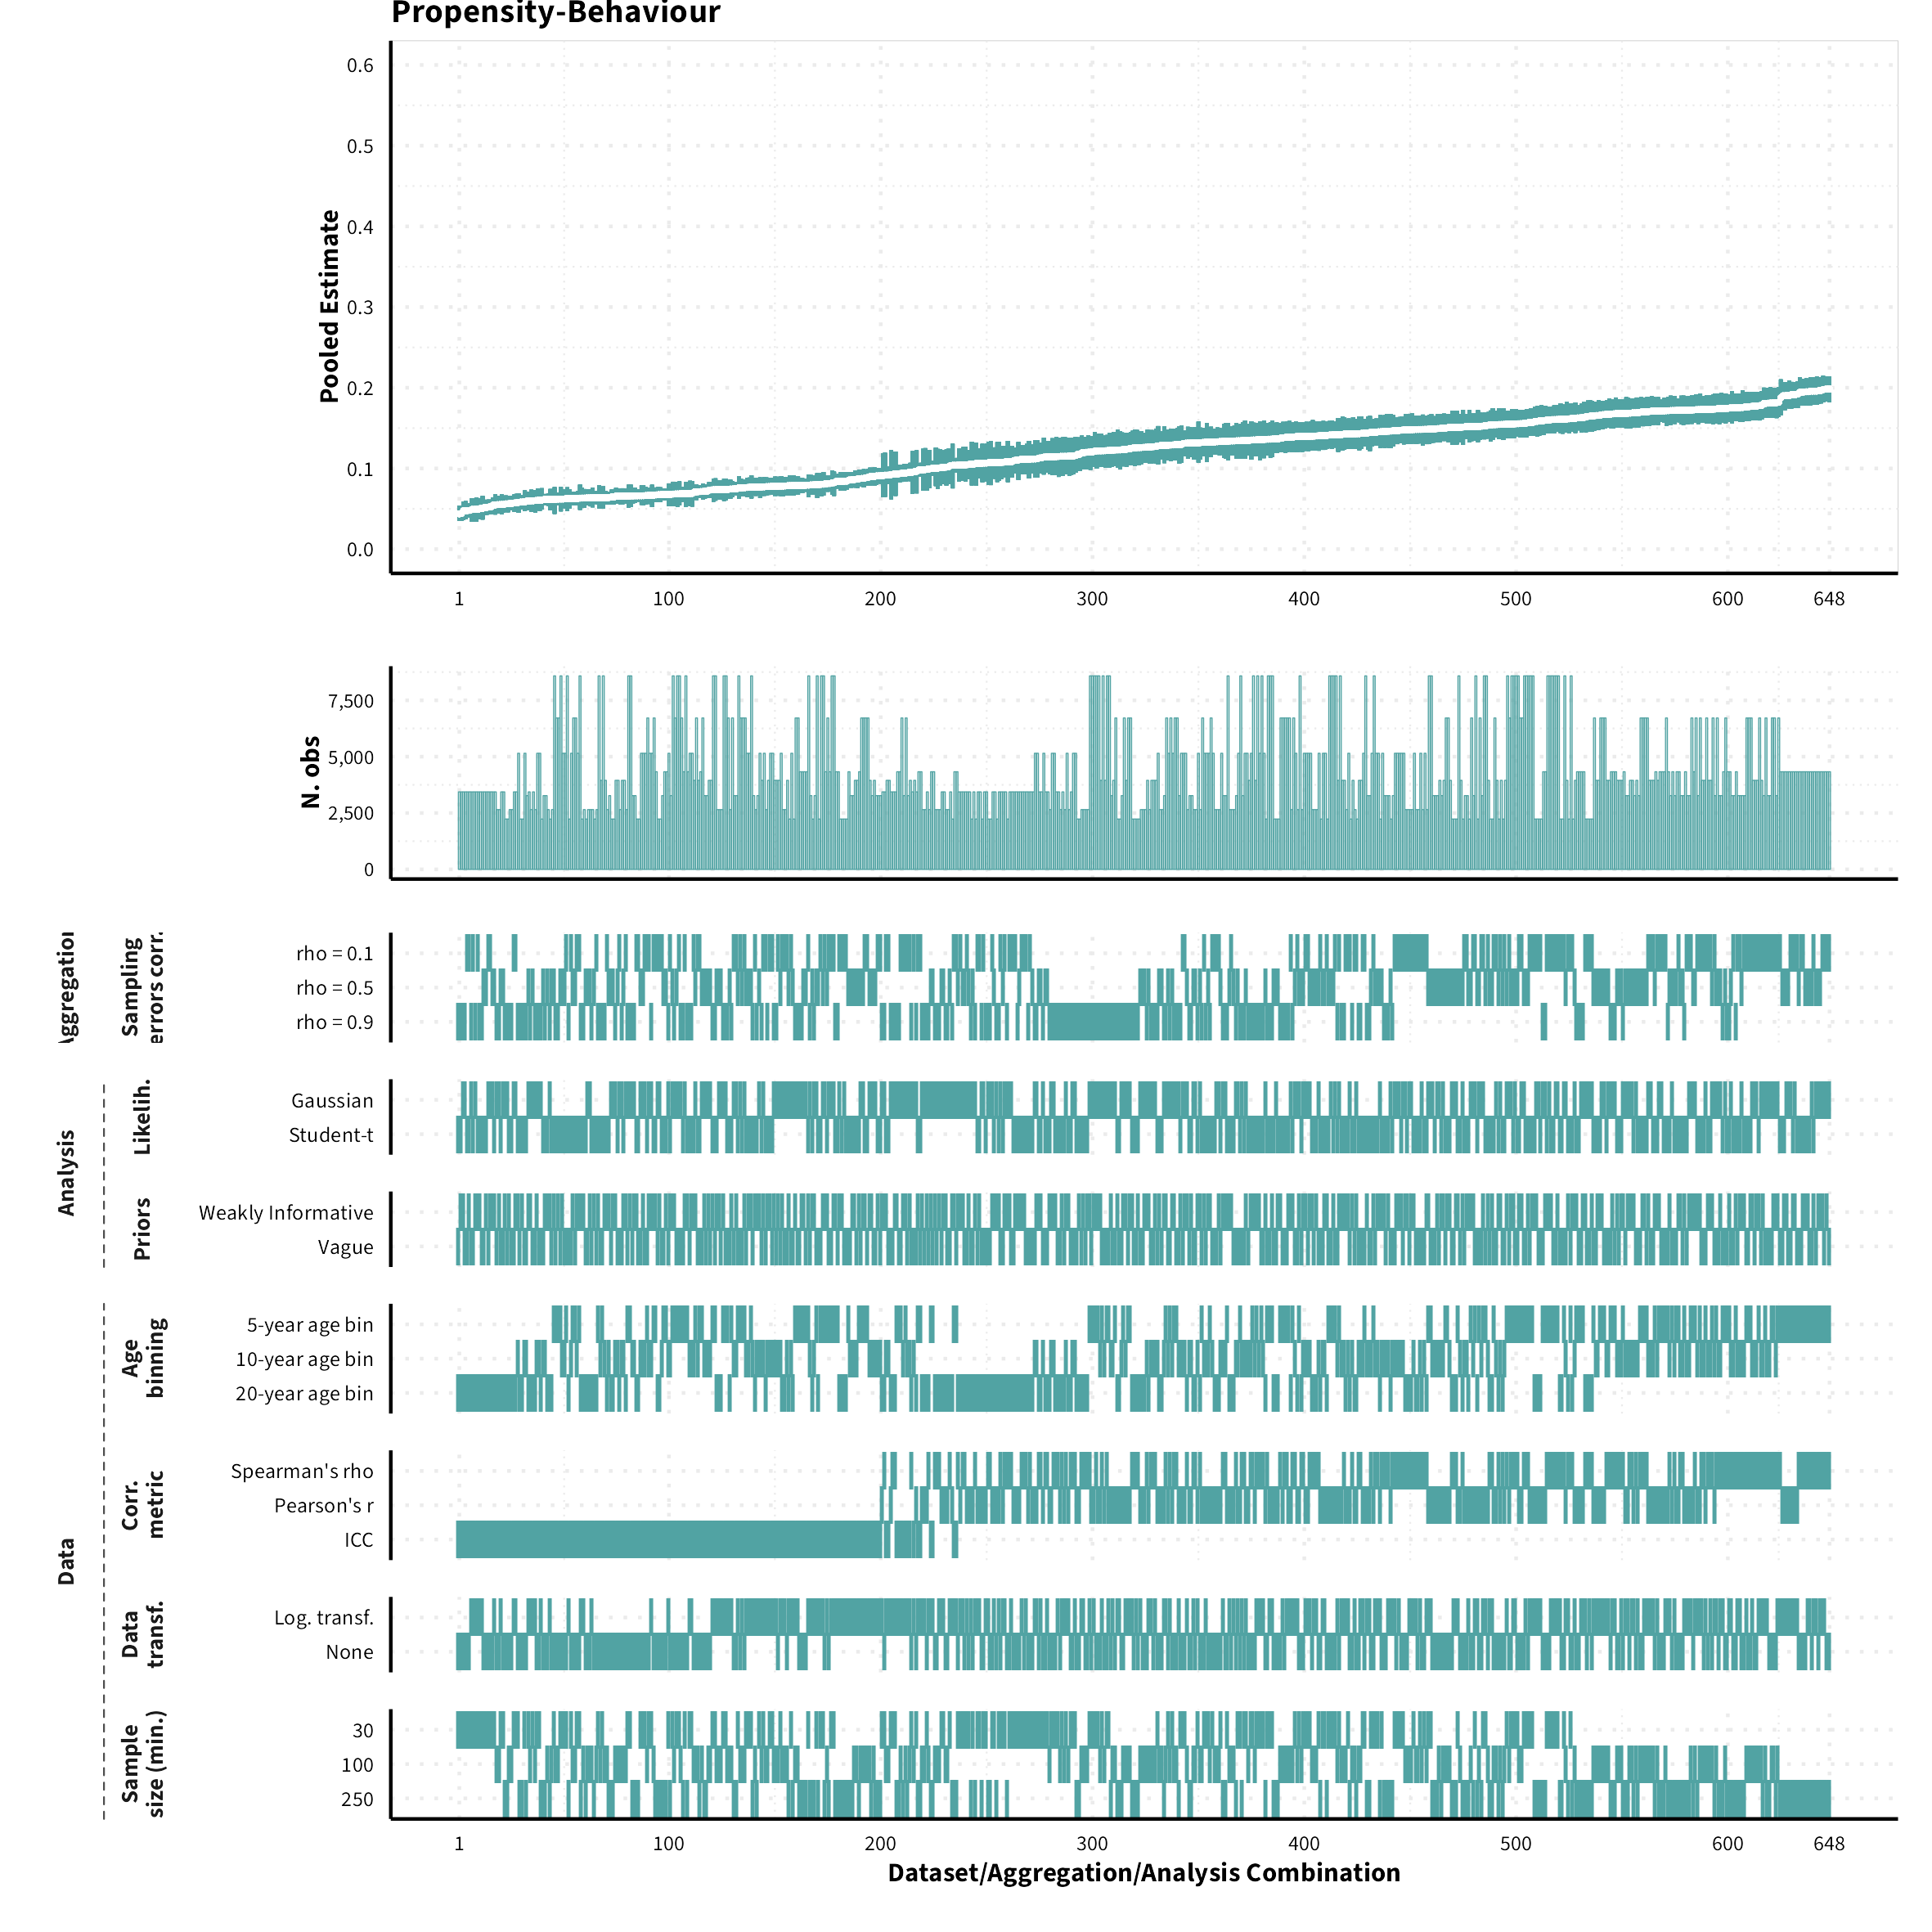
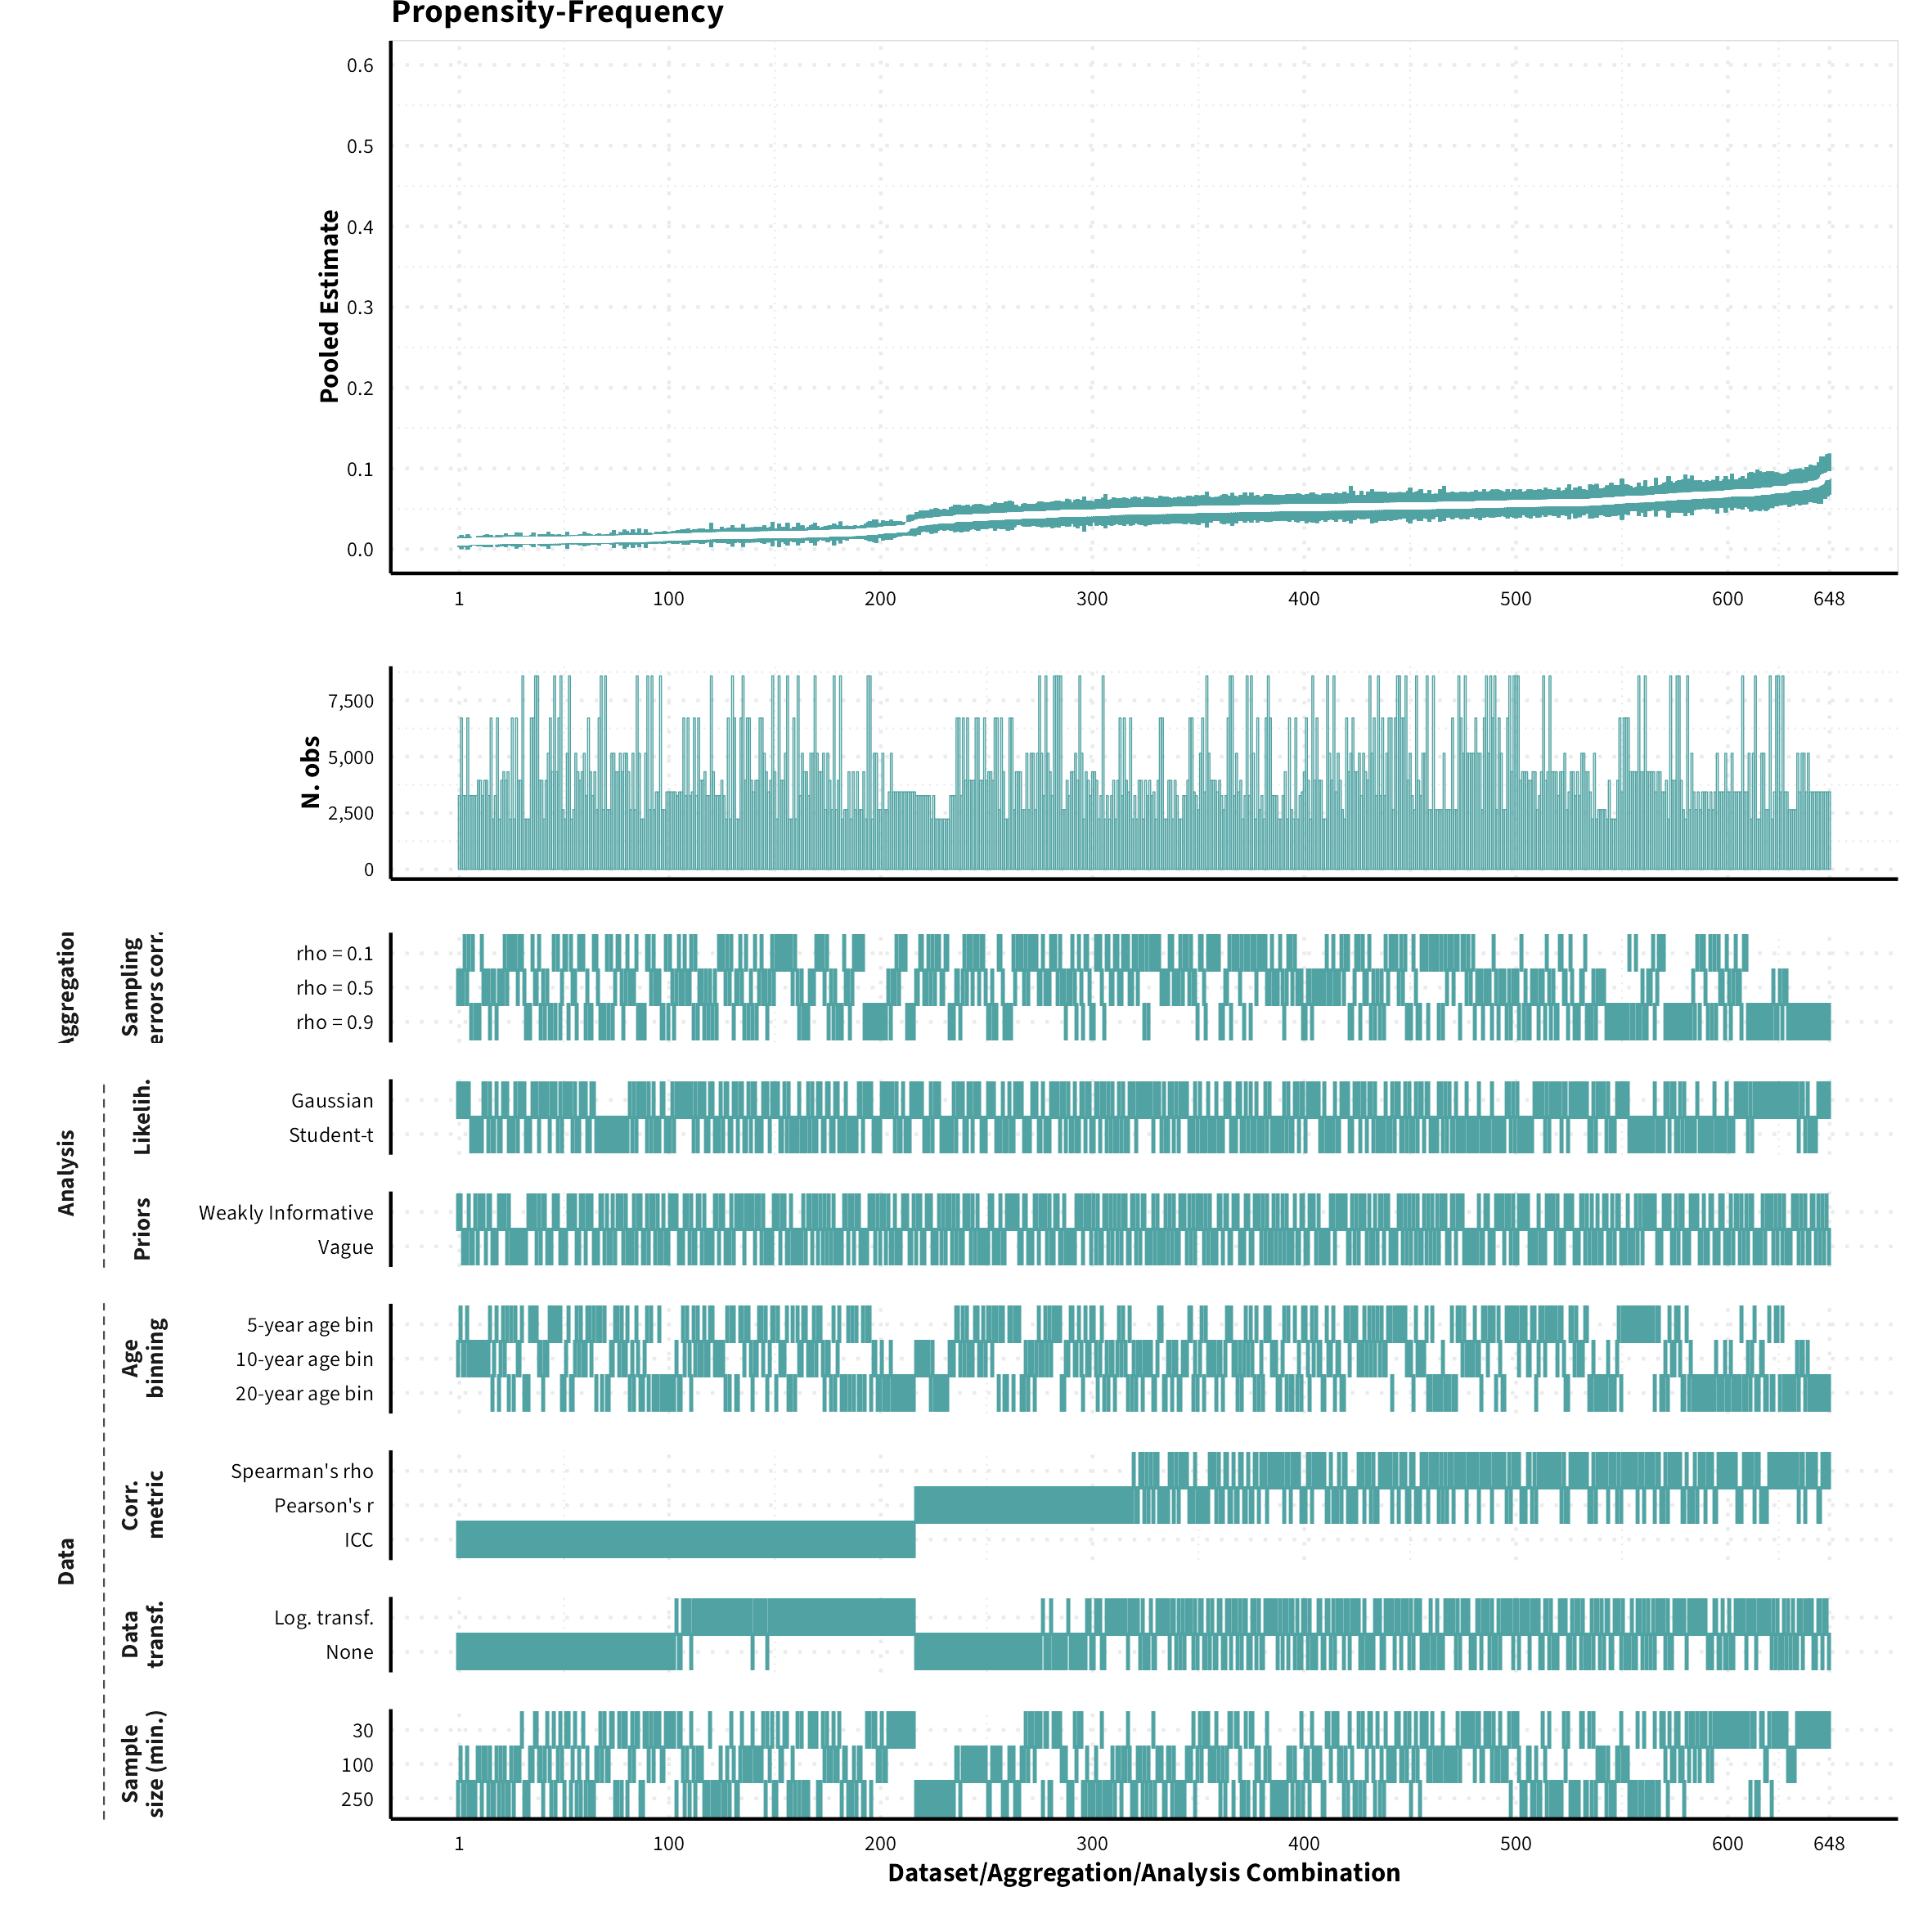
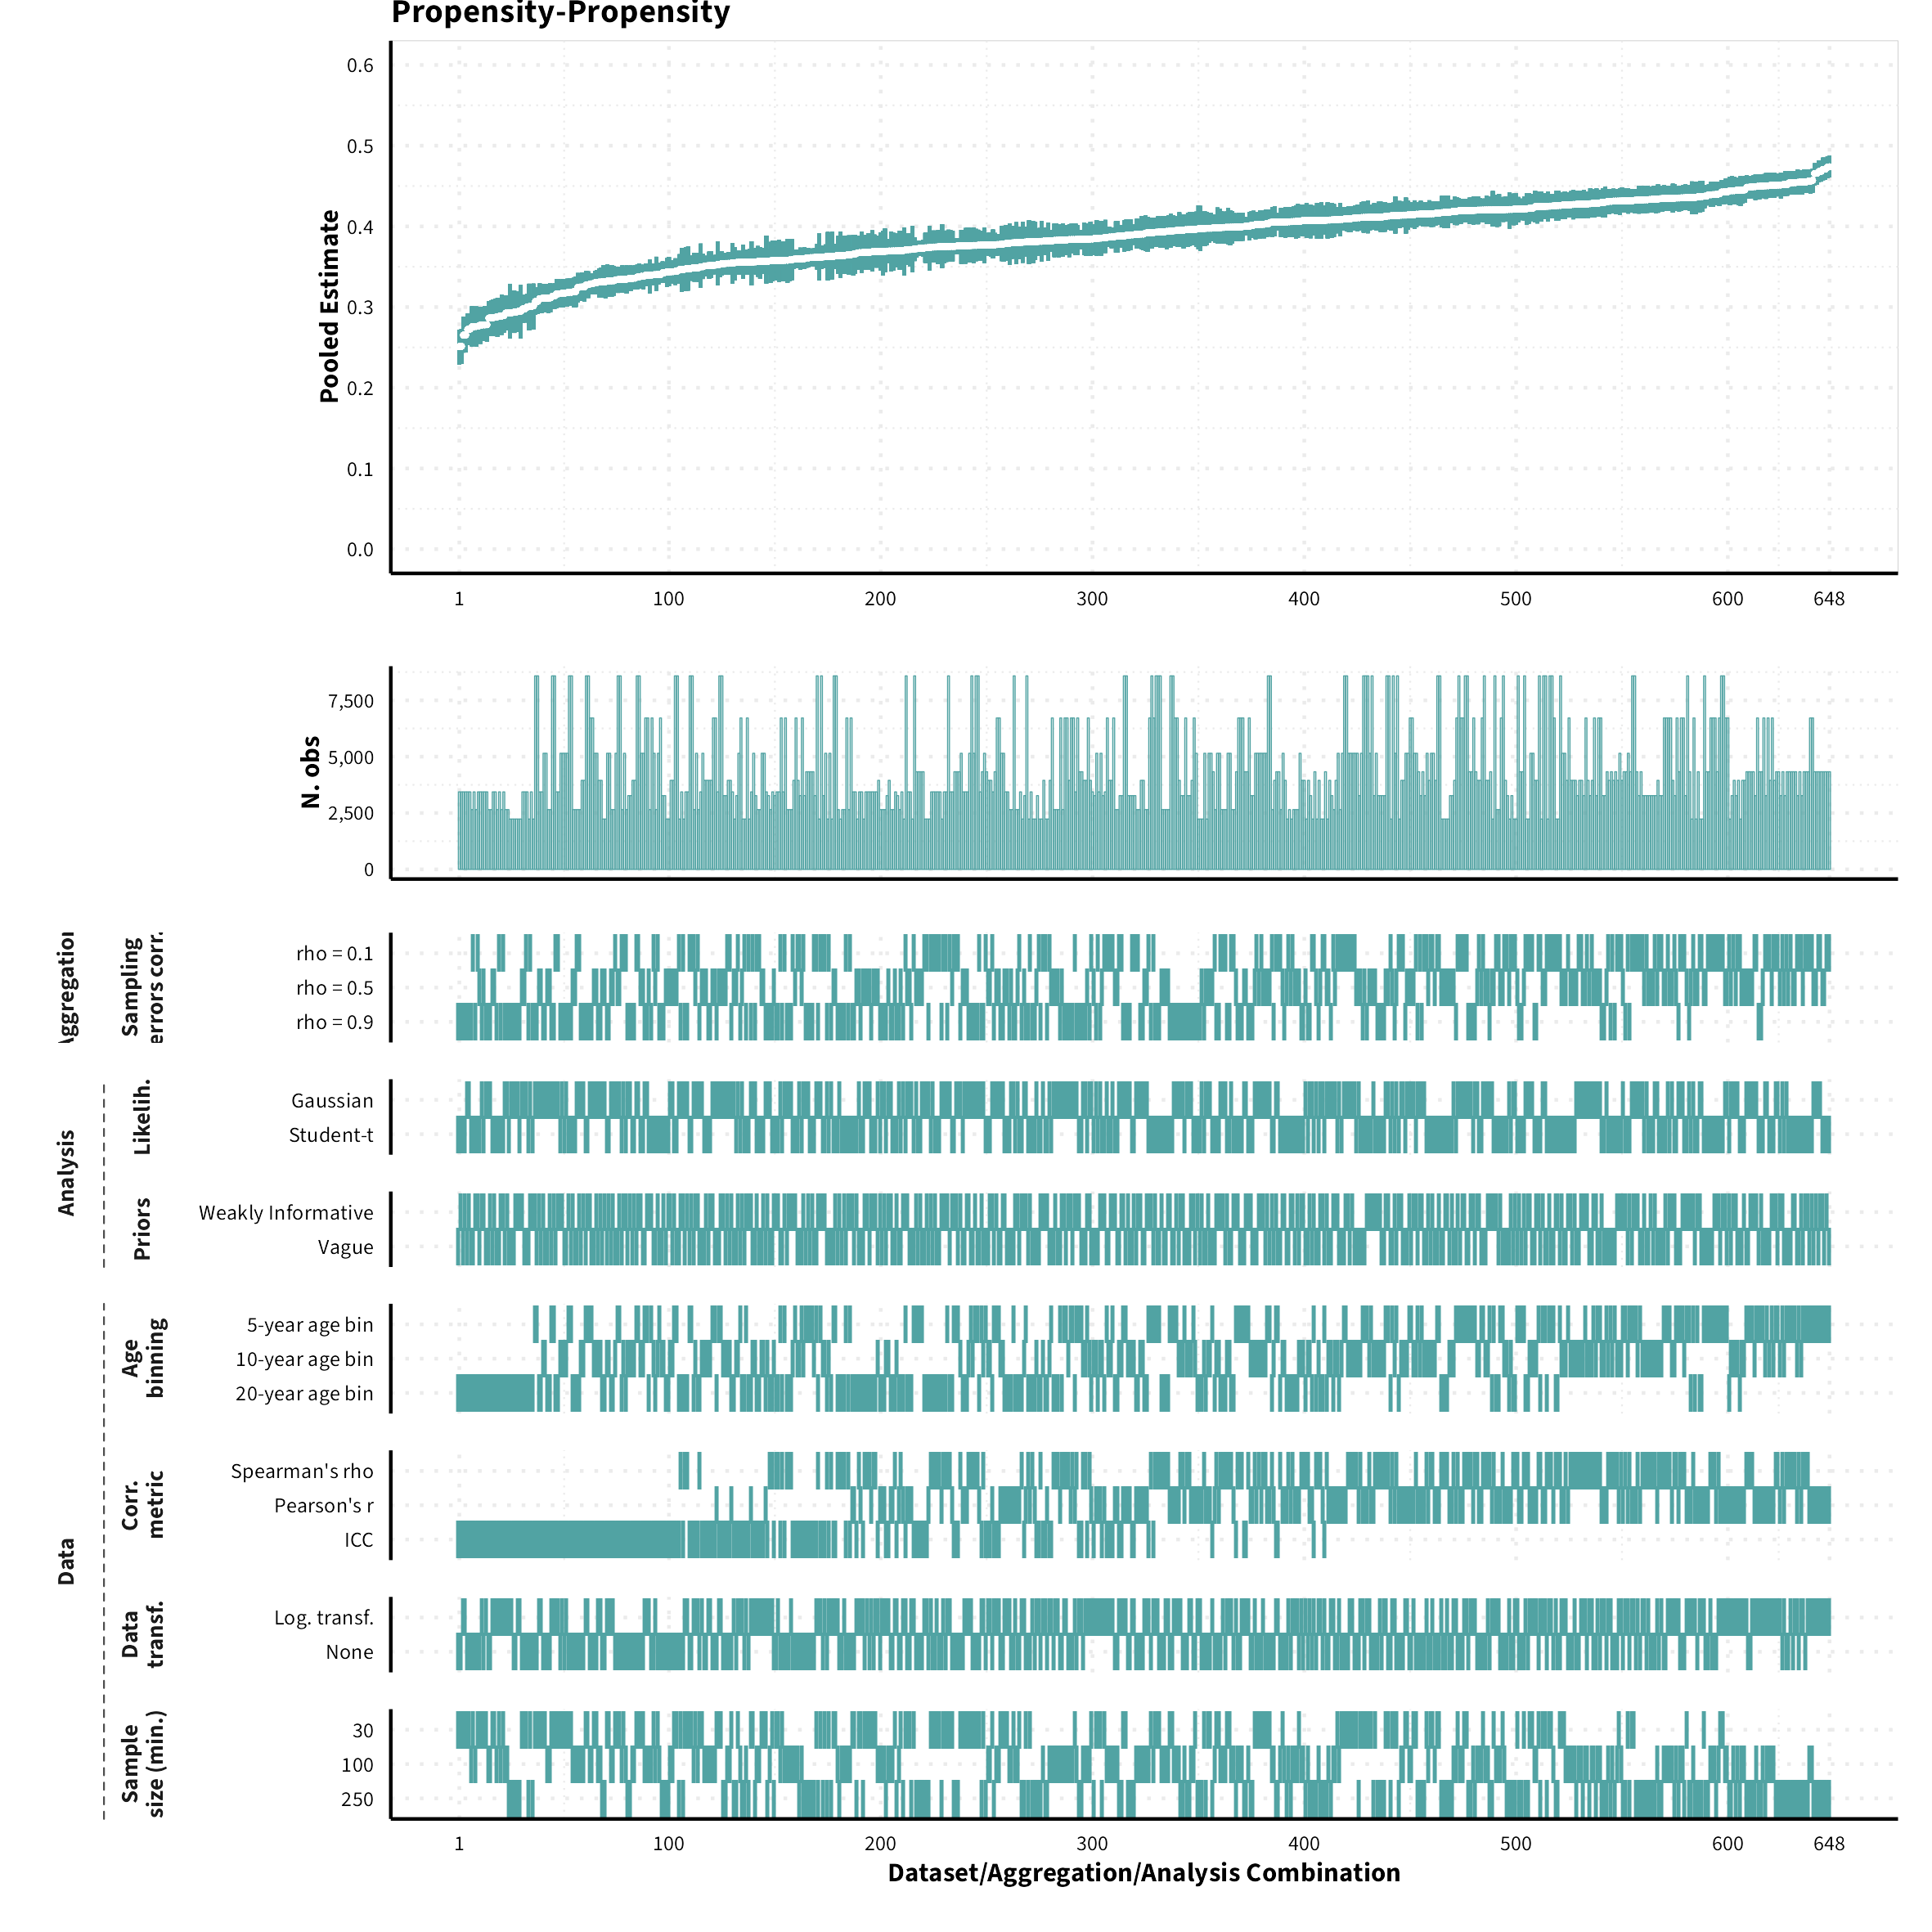
The plots in the different sections and tabs show in the upper panel the parameter estimate as a function of different data configuration/analysis decisions described in the lower panel (dashes indicate which option was used to process/analyze the data). The middle panel shows the number of effect sizes/correlations that were included in the analyses.
The plots have a similar format as those used for Specification Curve Analysis (Hall, Liu, Jansen, Dragicevic, Chevalier, & Kay, 2022; Simonsohn, Simmons, & Nelson, 2020)

Overview of data processing and analysis options. Options in bold represent the results reported in the main paper.
References
Hall, B.D., Liu, Y., Jansen, Y., Dragicevic, P., Chevalier, F. and Kay, M. (2022), A Survey of Tasks and Visualizations in Multiverse Analysis Reports. Computer Graphics Forum, 41, 402-426. doi: 10.1111/cgf.14443
Simonsohn, U., Simmons, J. P., & Nelson, L. D. (2020). Specification curve analysis. Nature Human Behaviour, 4(11), 1208-1214. doi: 10.1038/s41562-020-0912-z
Size of datasets
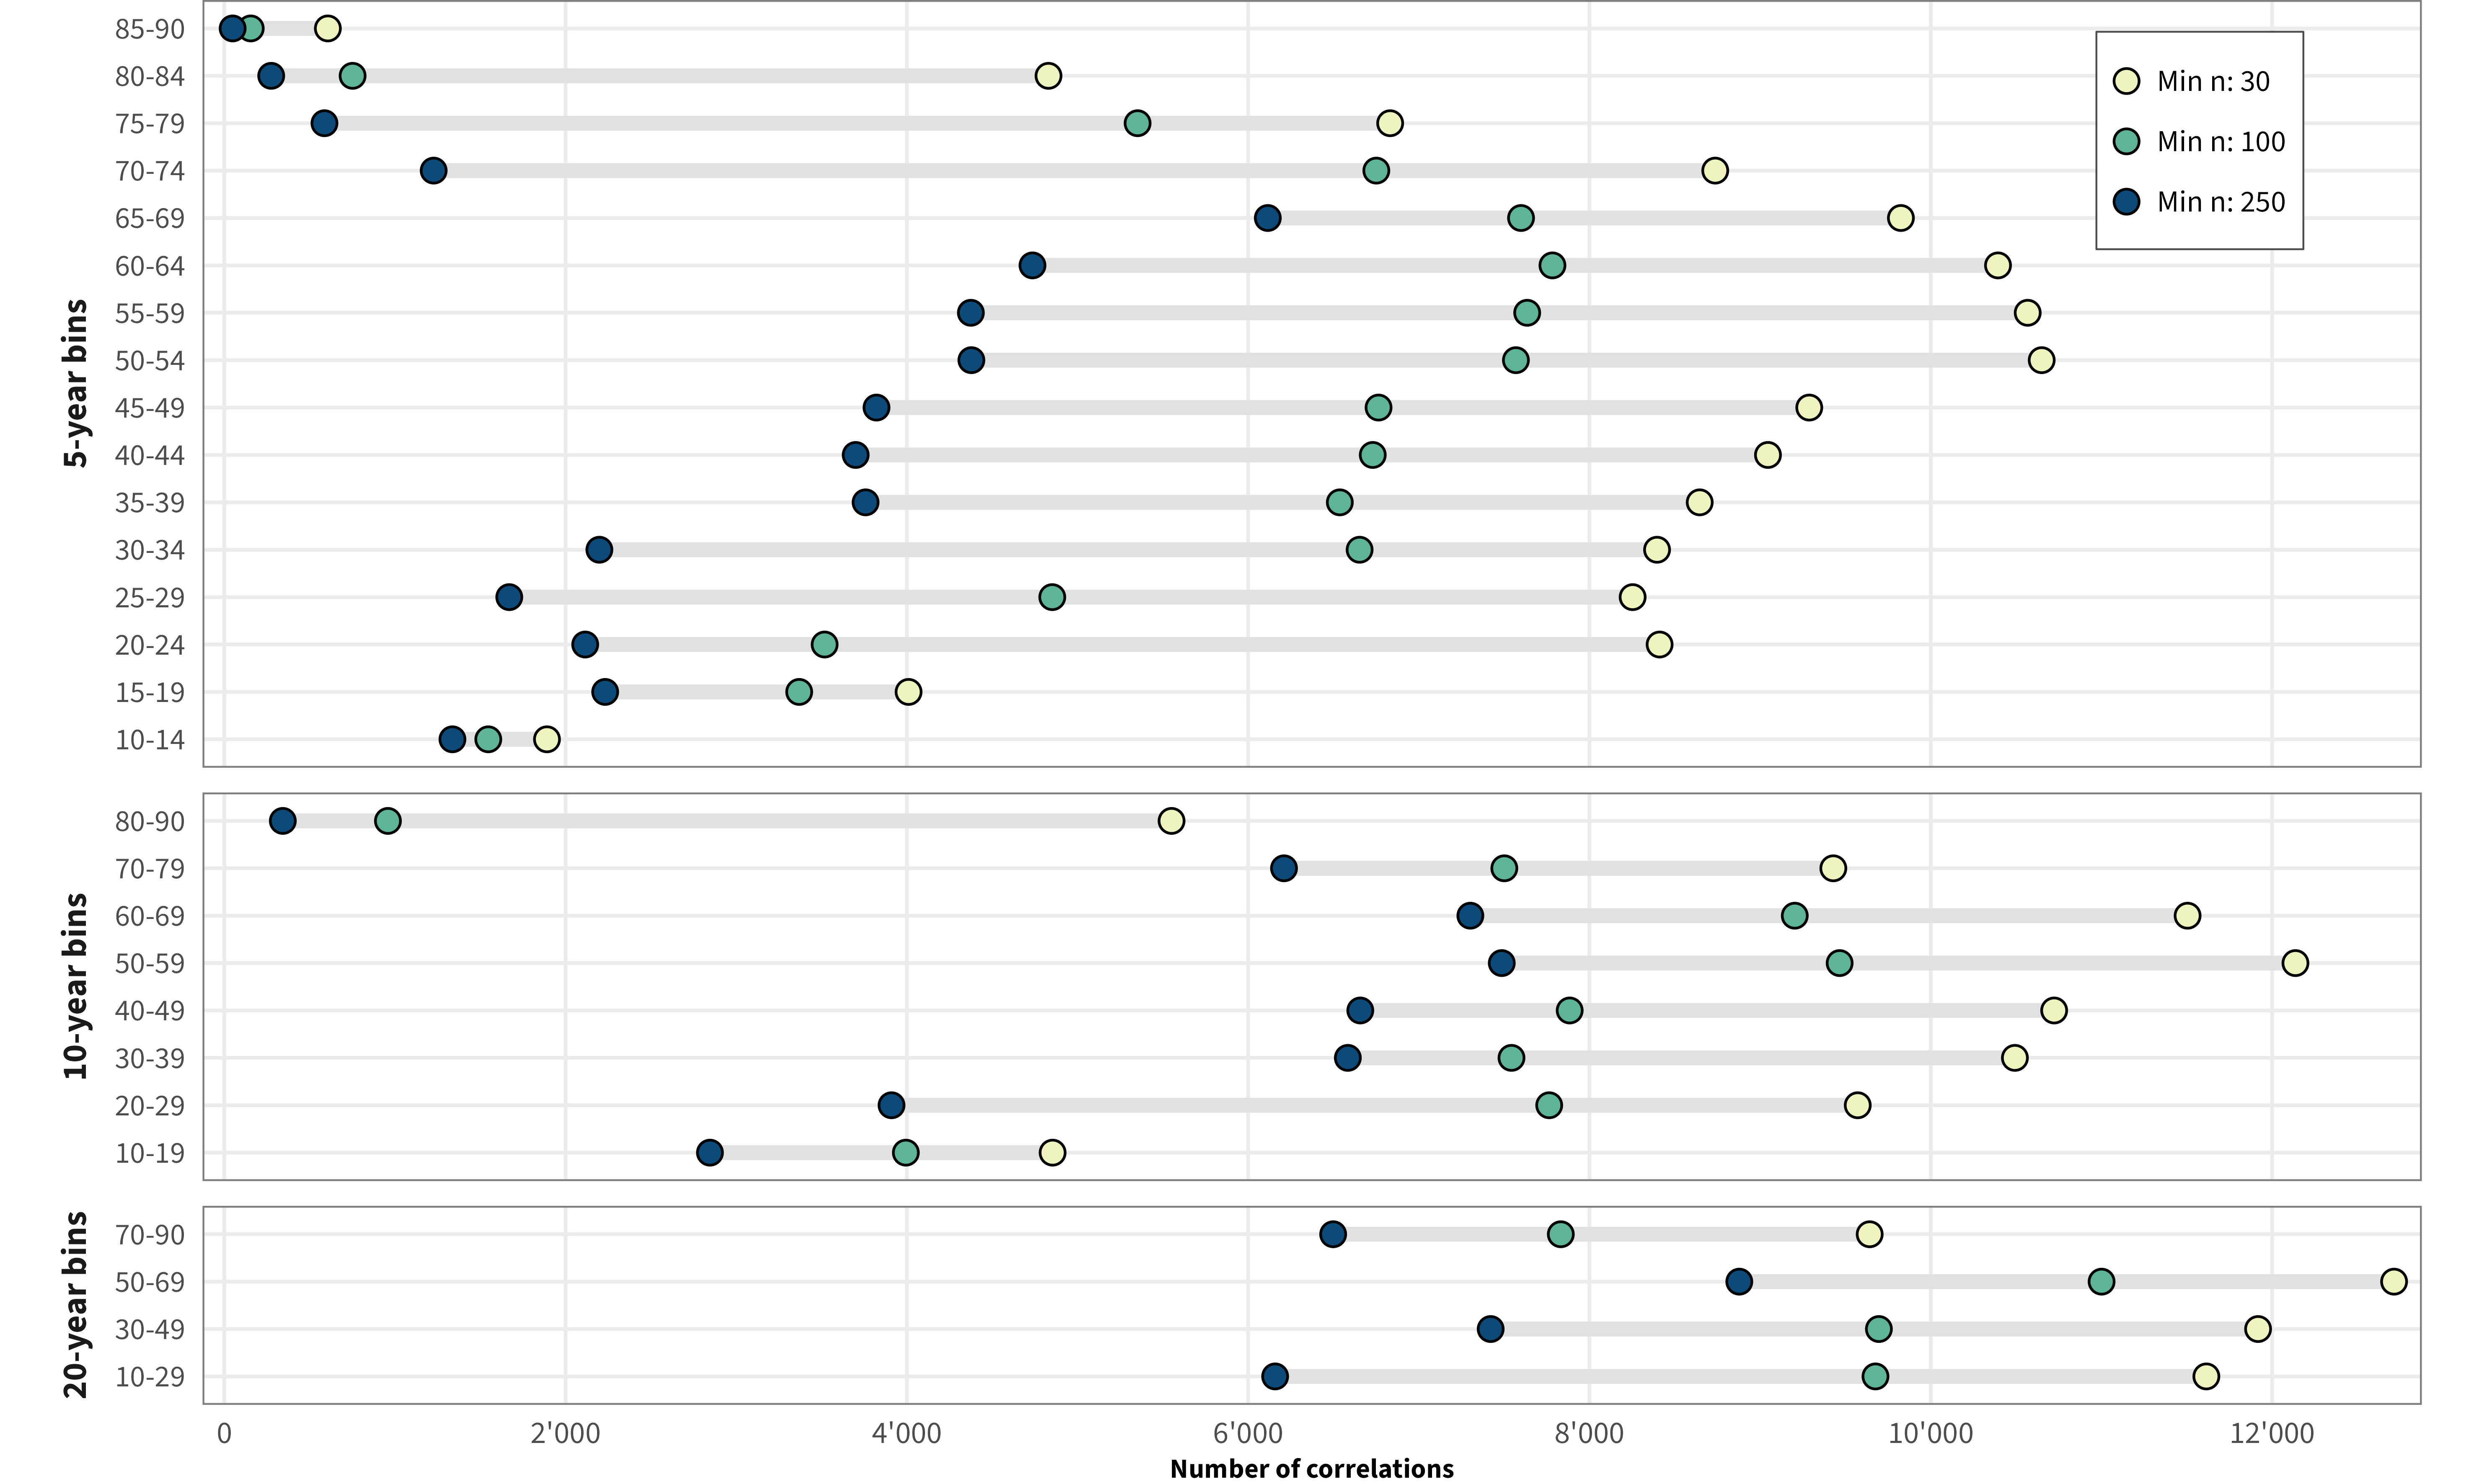
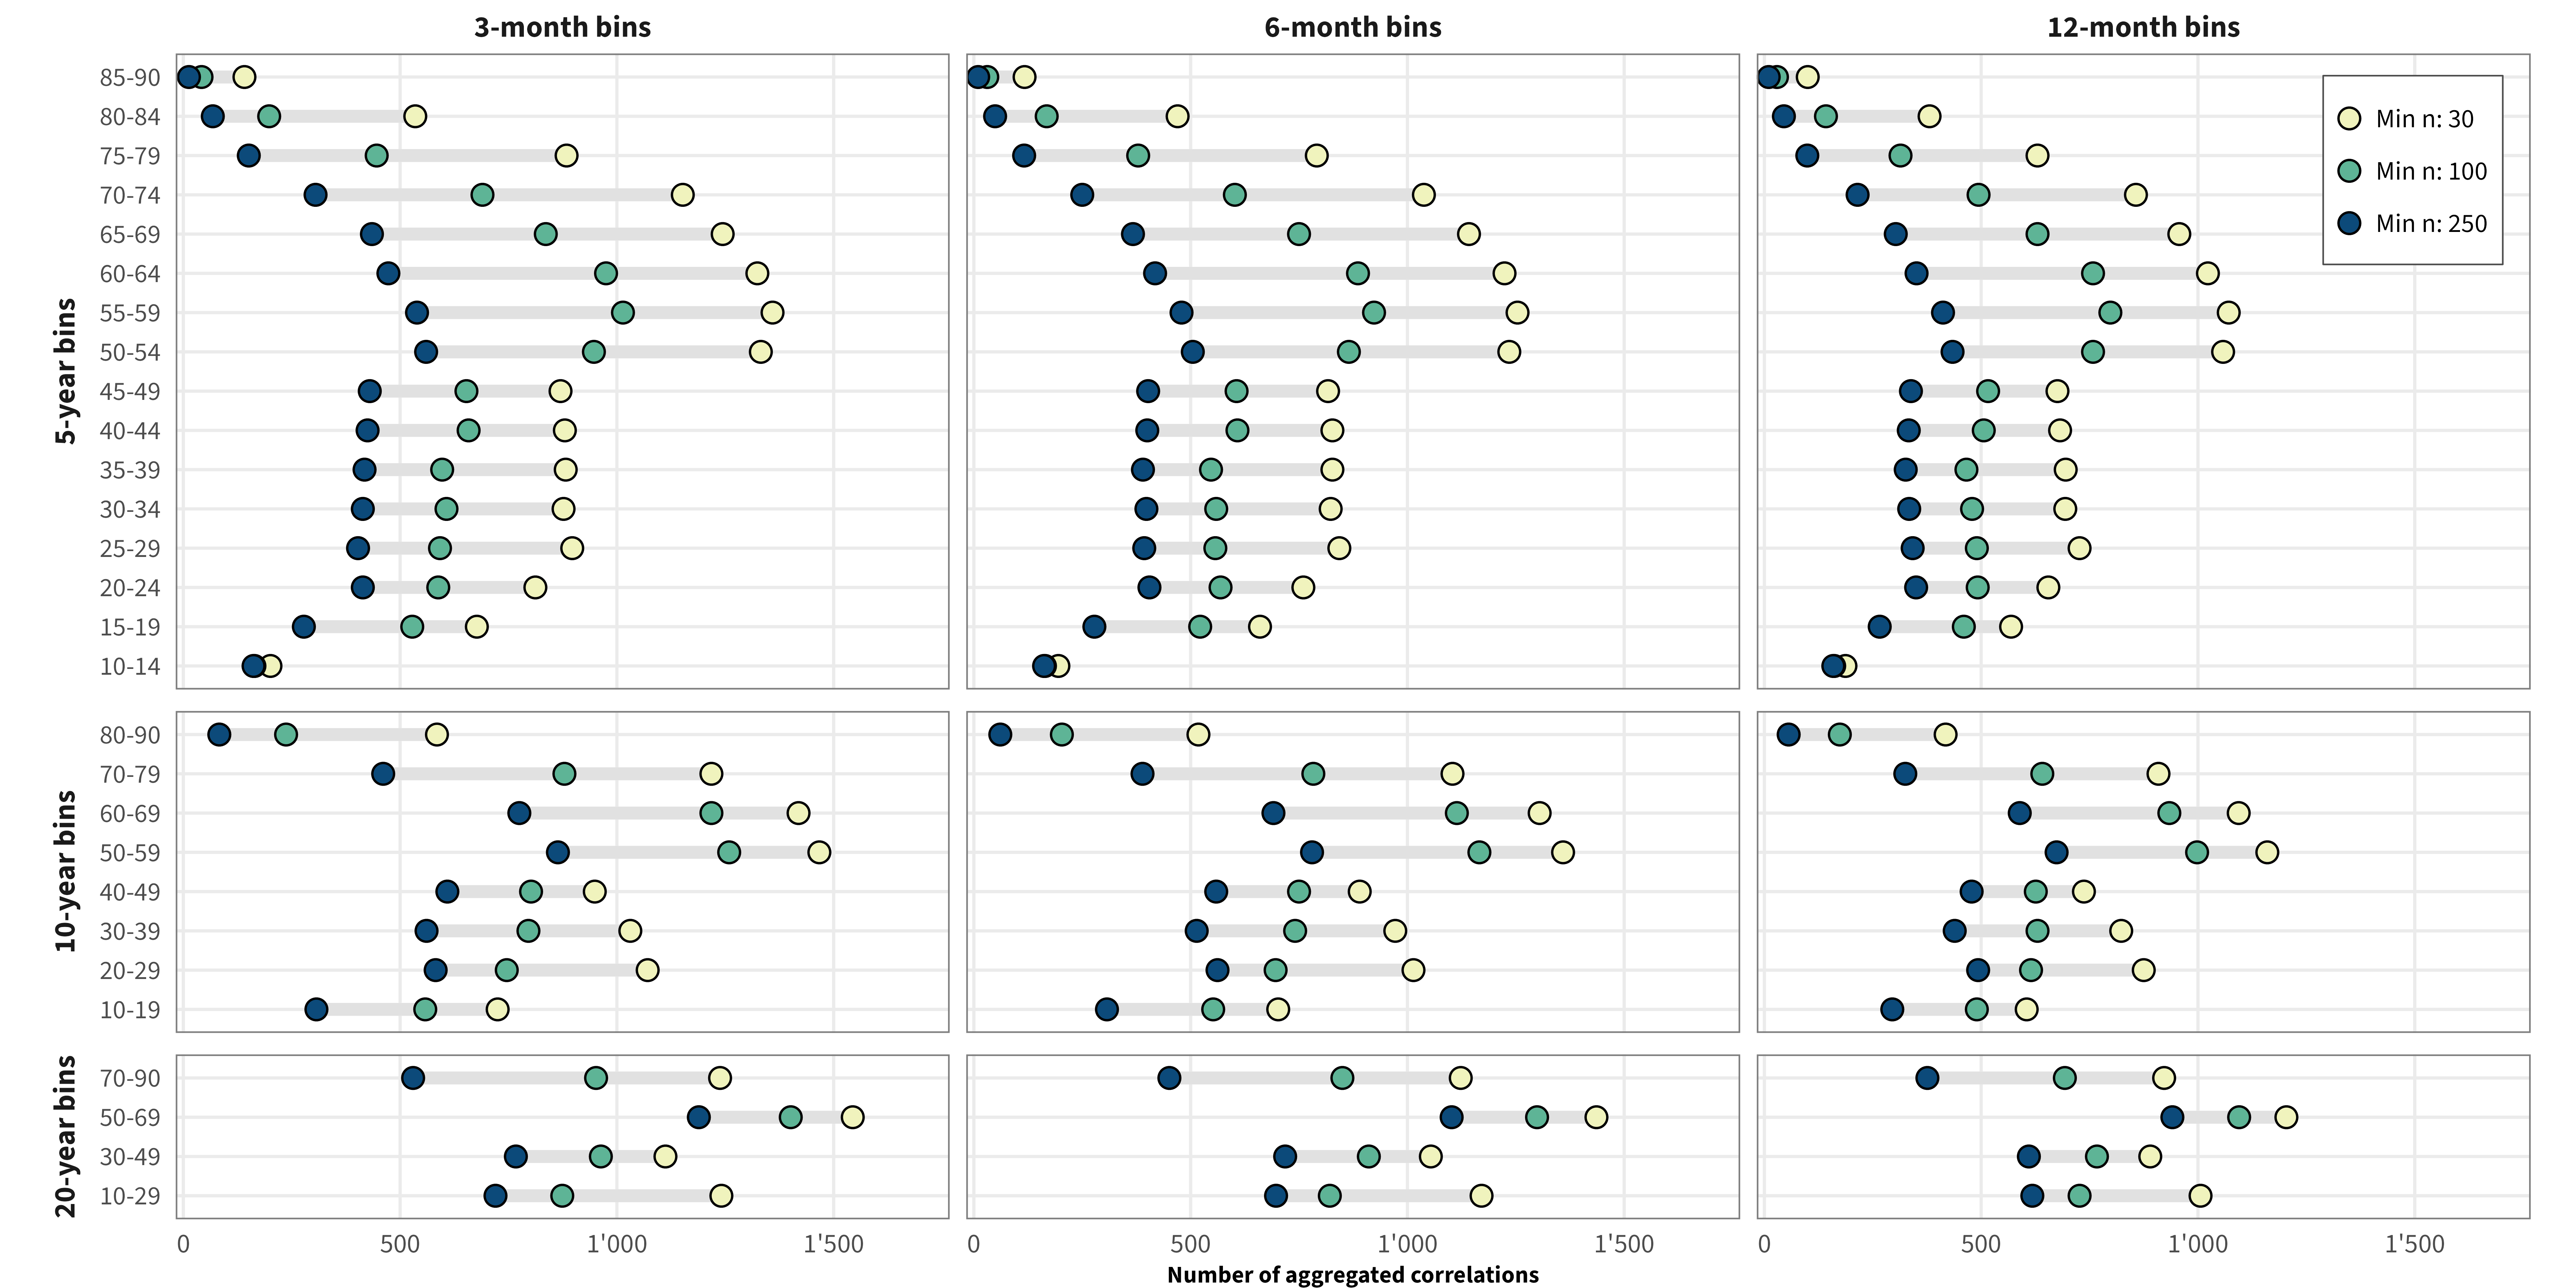
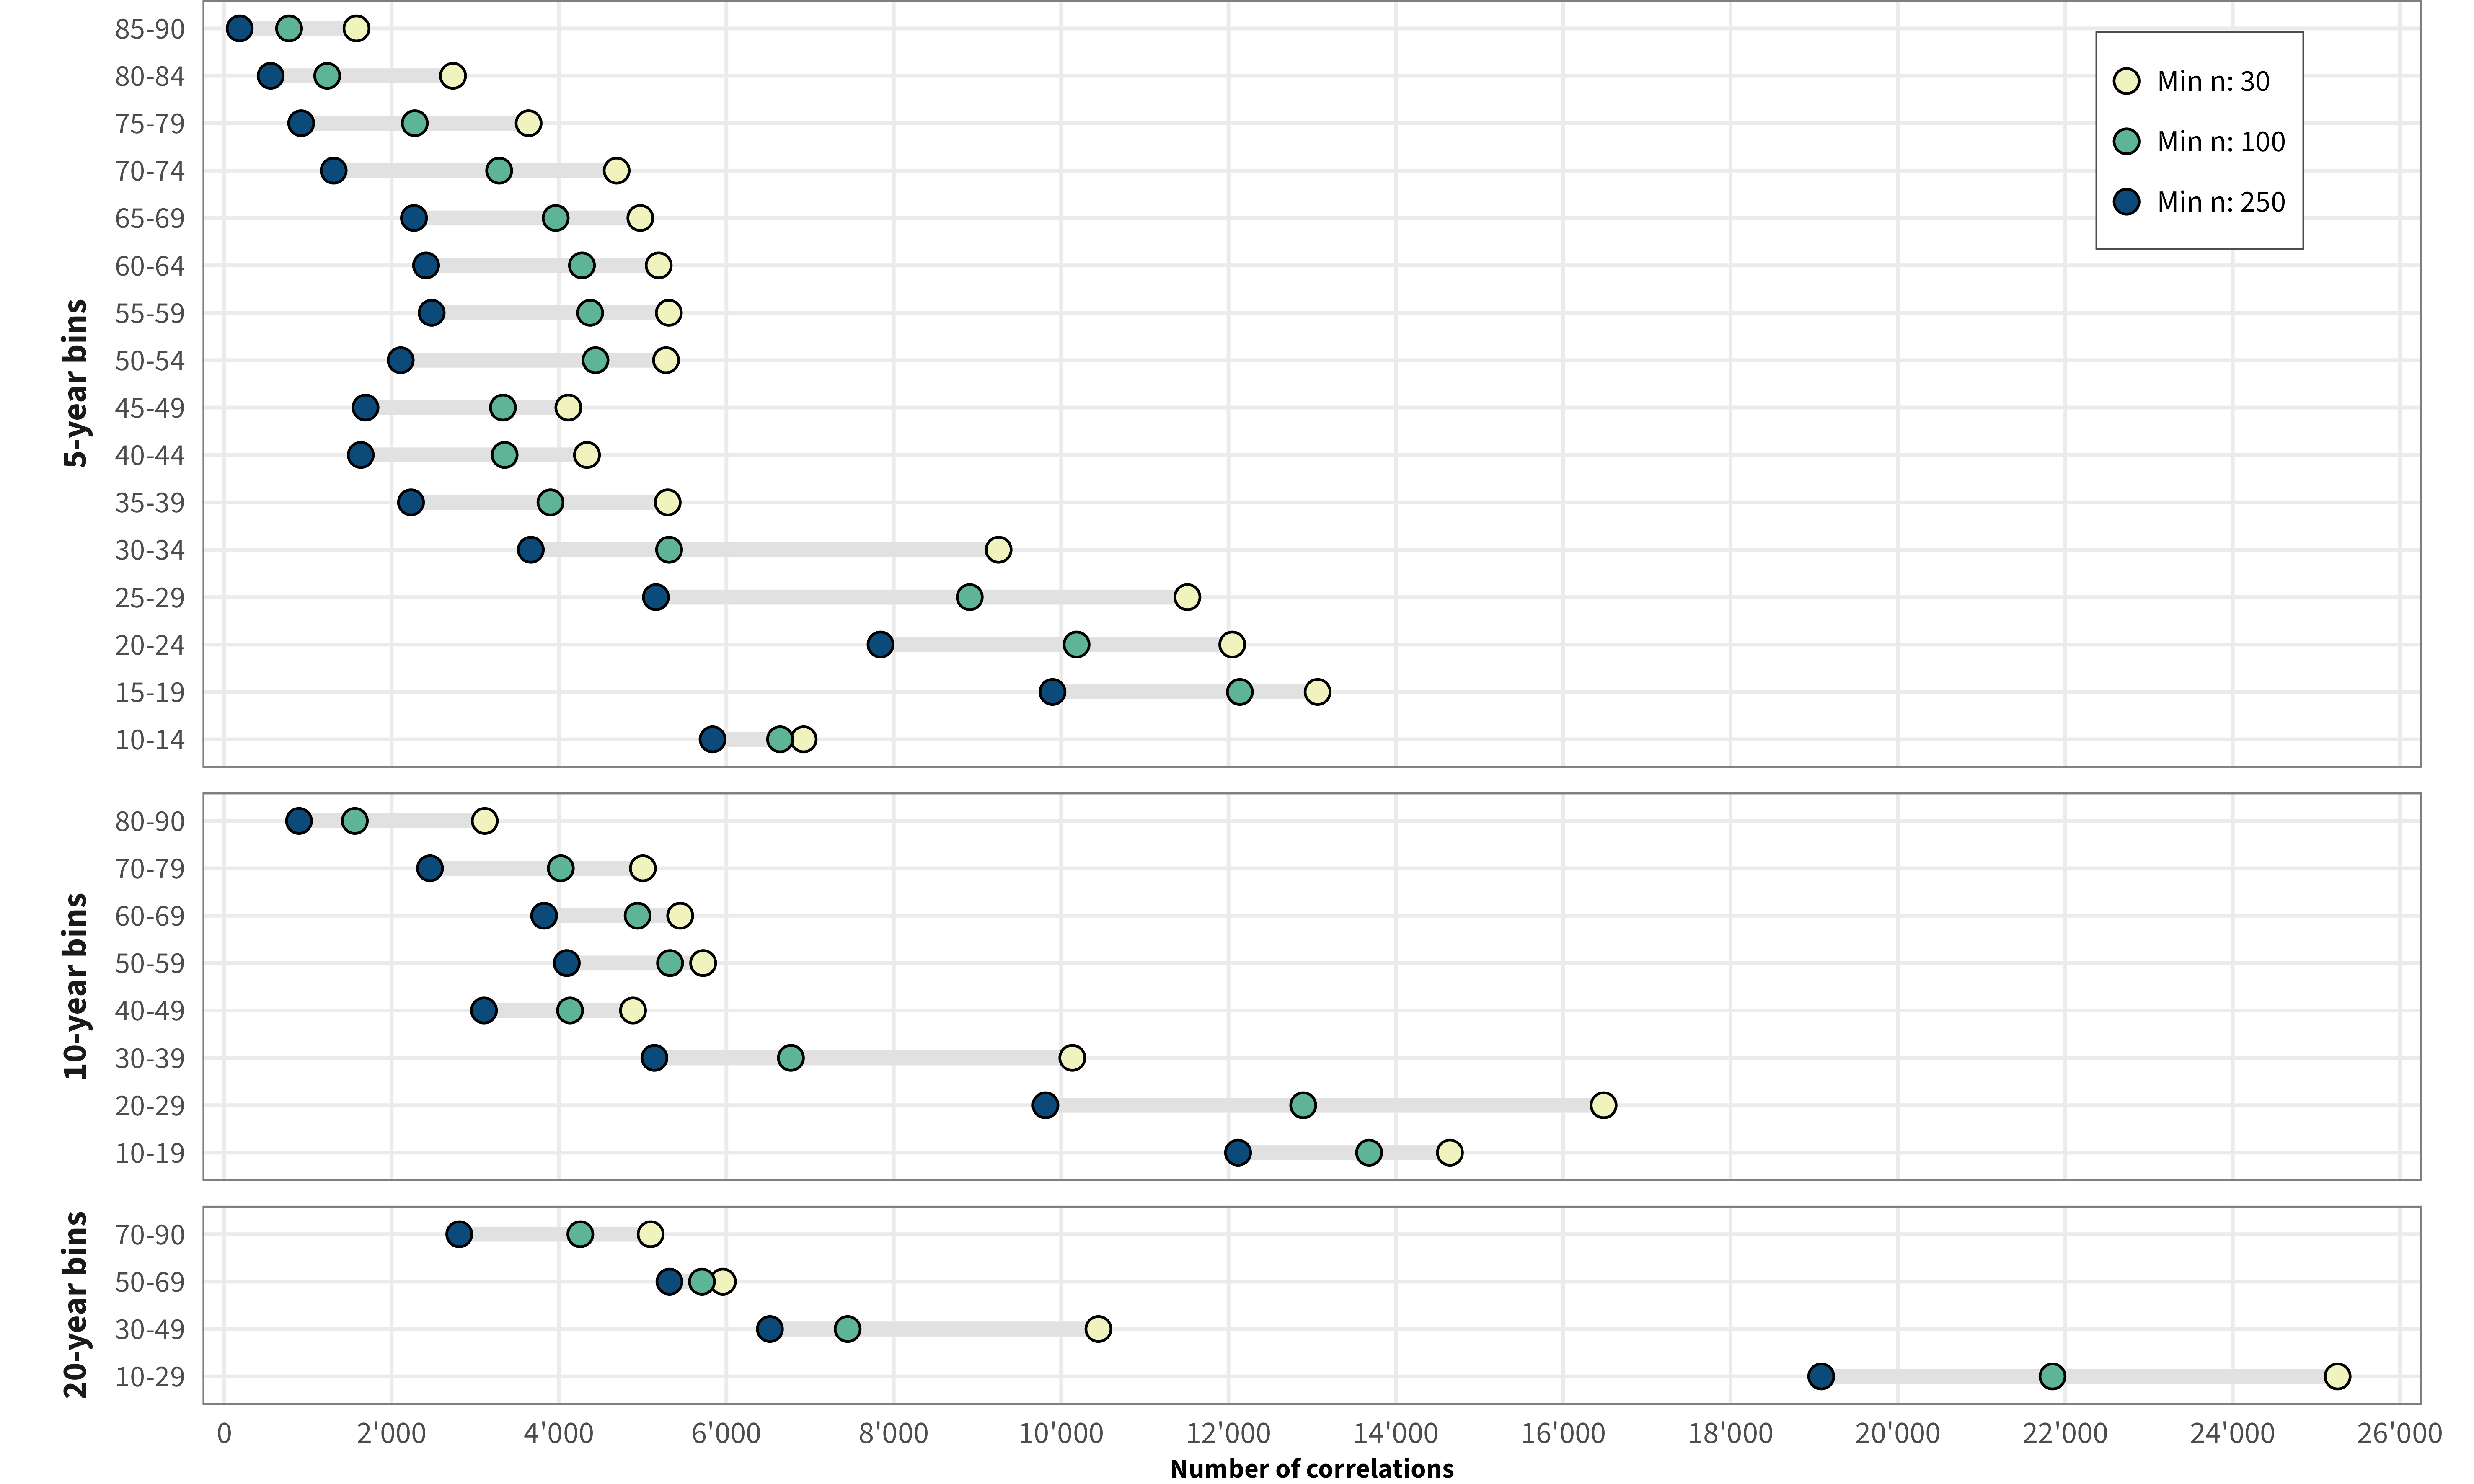
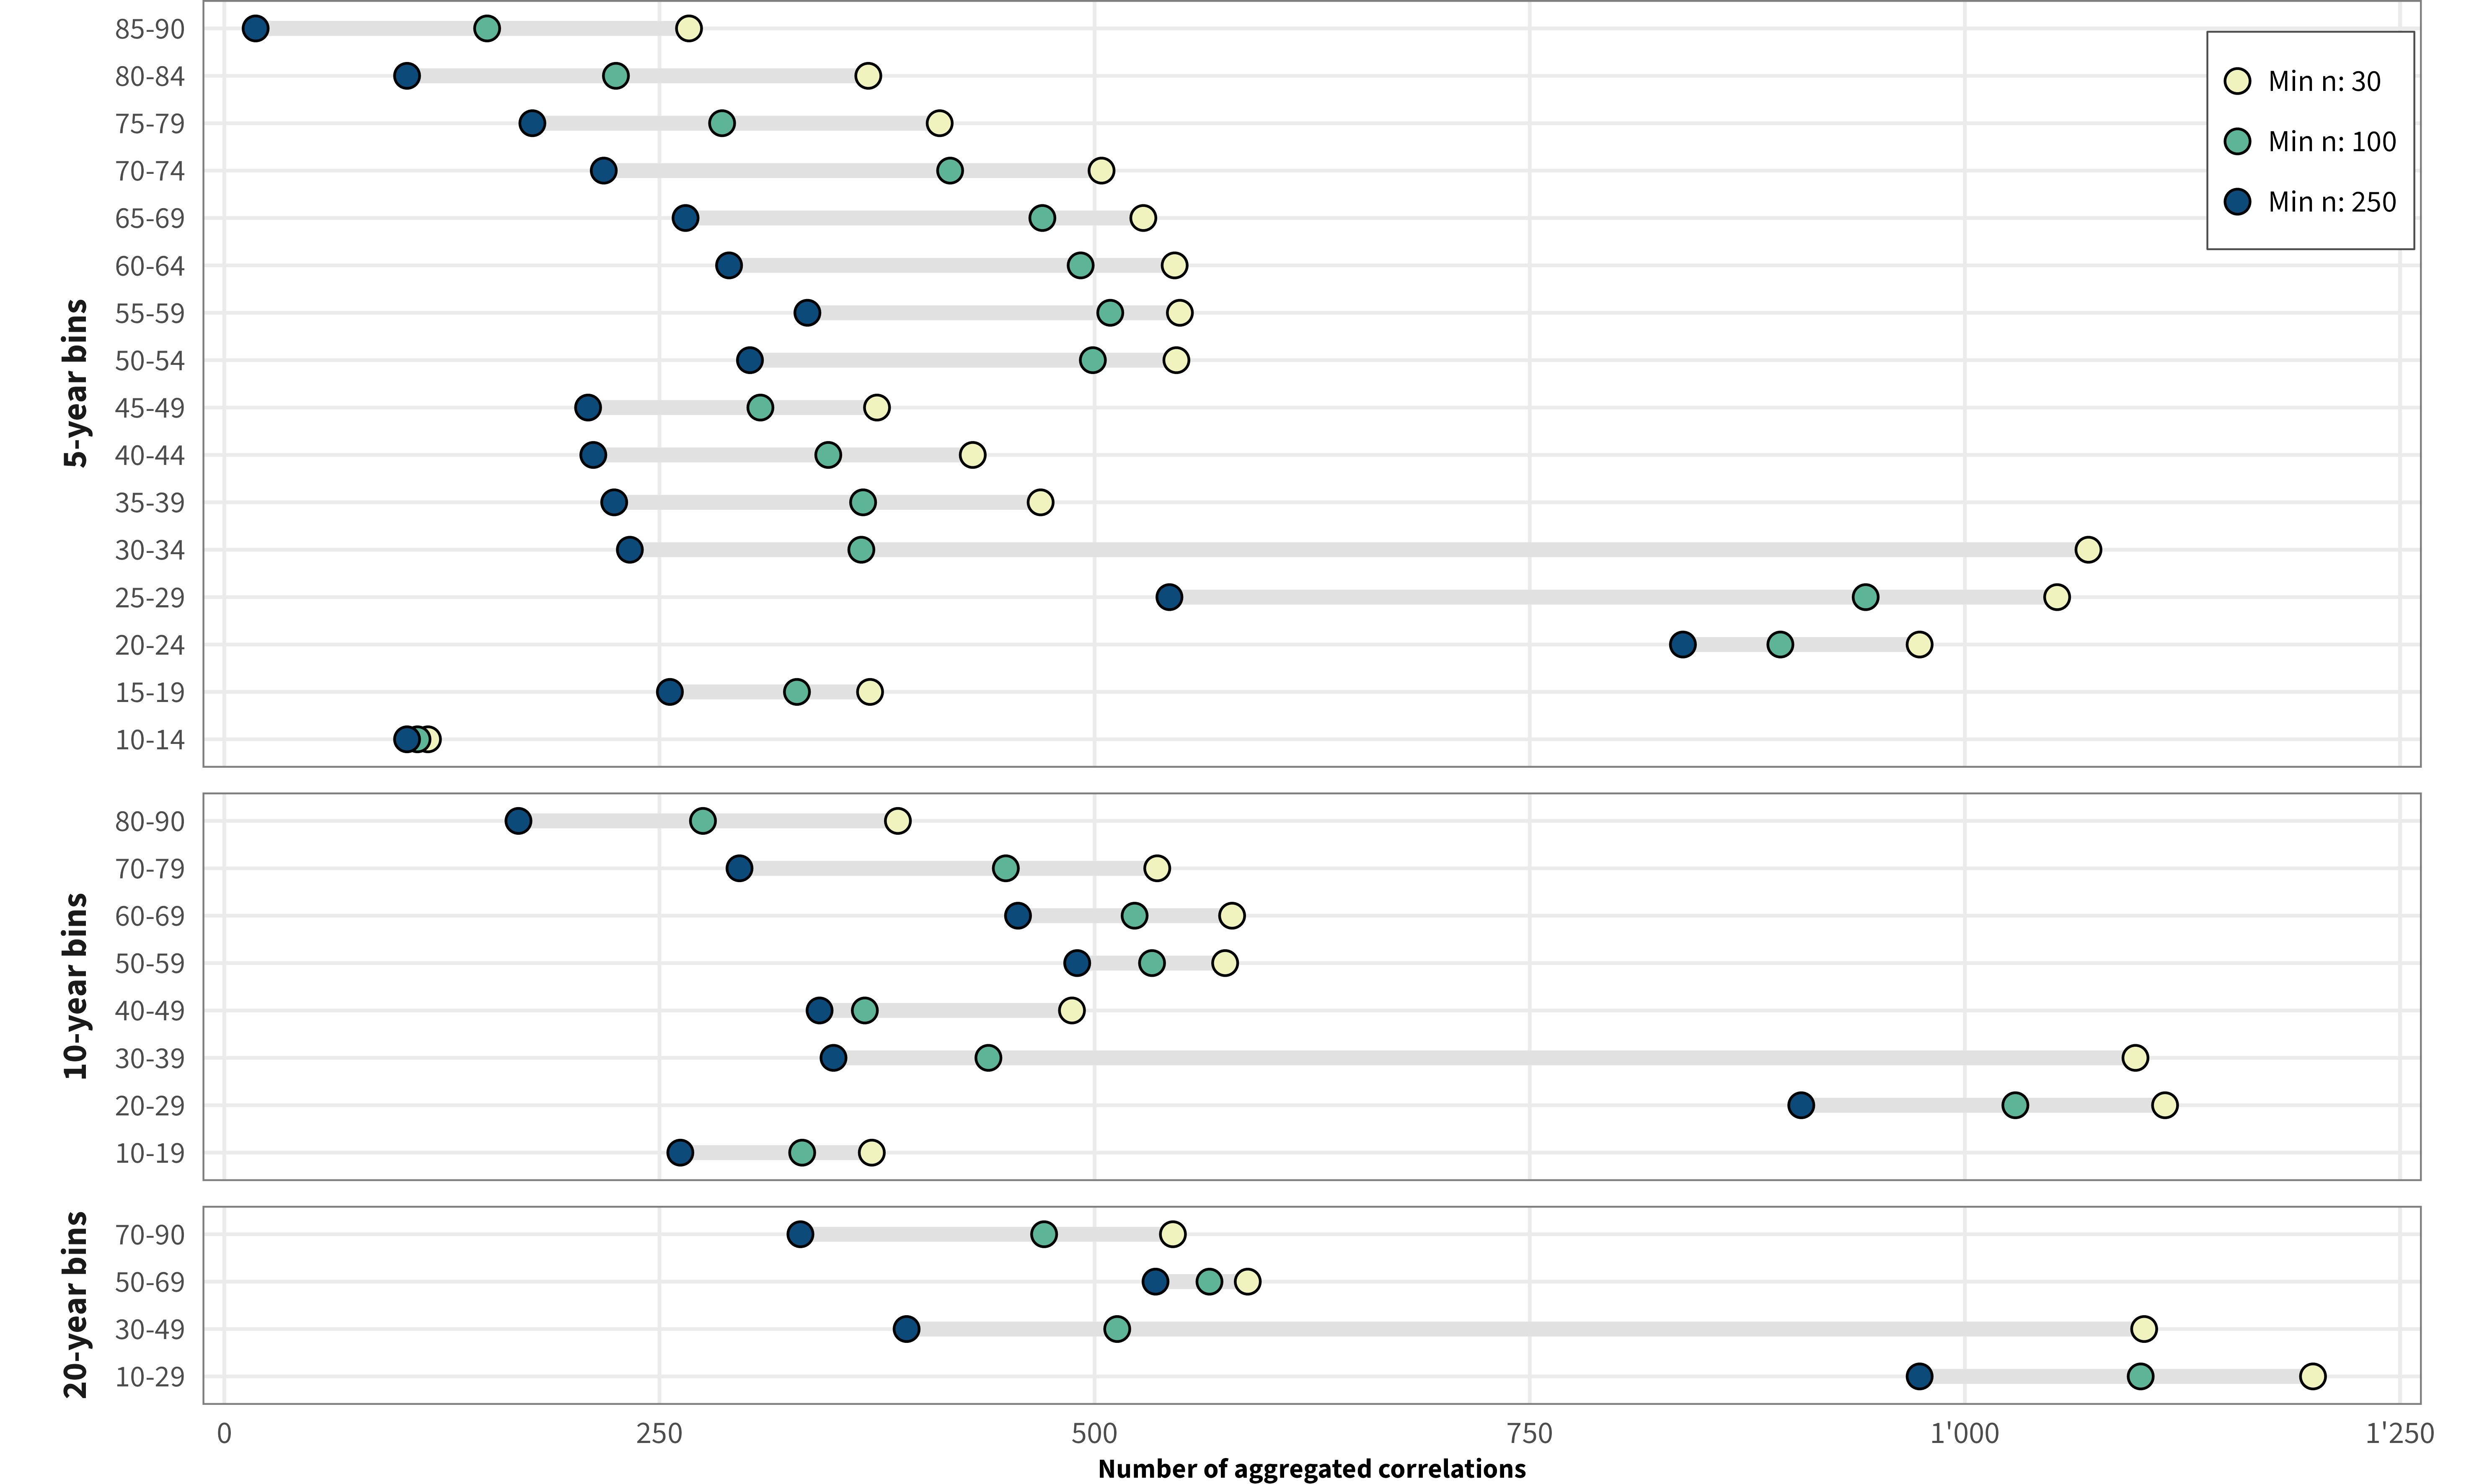
Based on the threshold used for the sample size (i.e., minimum of 30, 100 or 250 responses to compute the correlation) the size of the dataset varies. Below is an overview of the number of correlation coefficients for each age group for different thresholds of minimum sample size.
Test-Retest Correlations
Non-Aggregated Correlations
Aggregated Correlations
Inter-Correlations
Non-Aggregated Correlations
Aggregated Correlations
Temporal Stability
Variance Decomposition
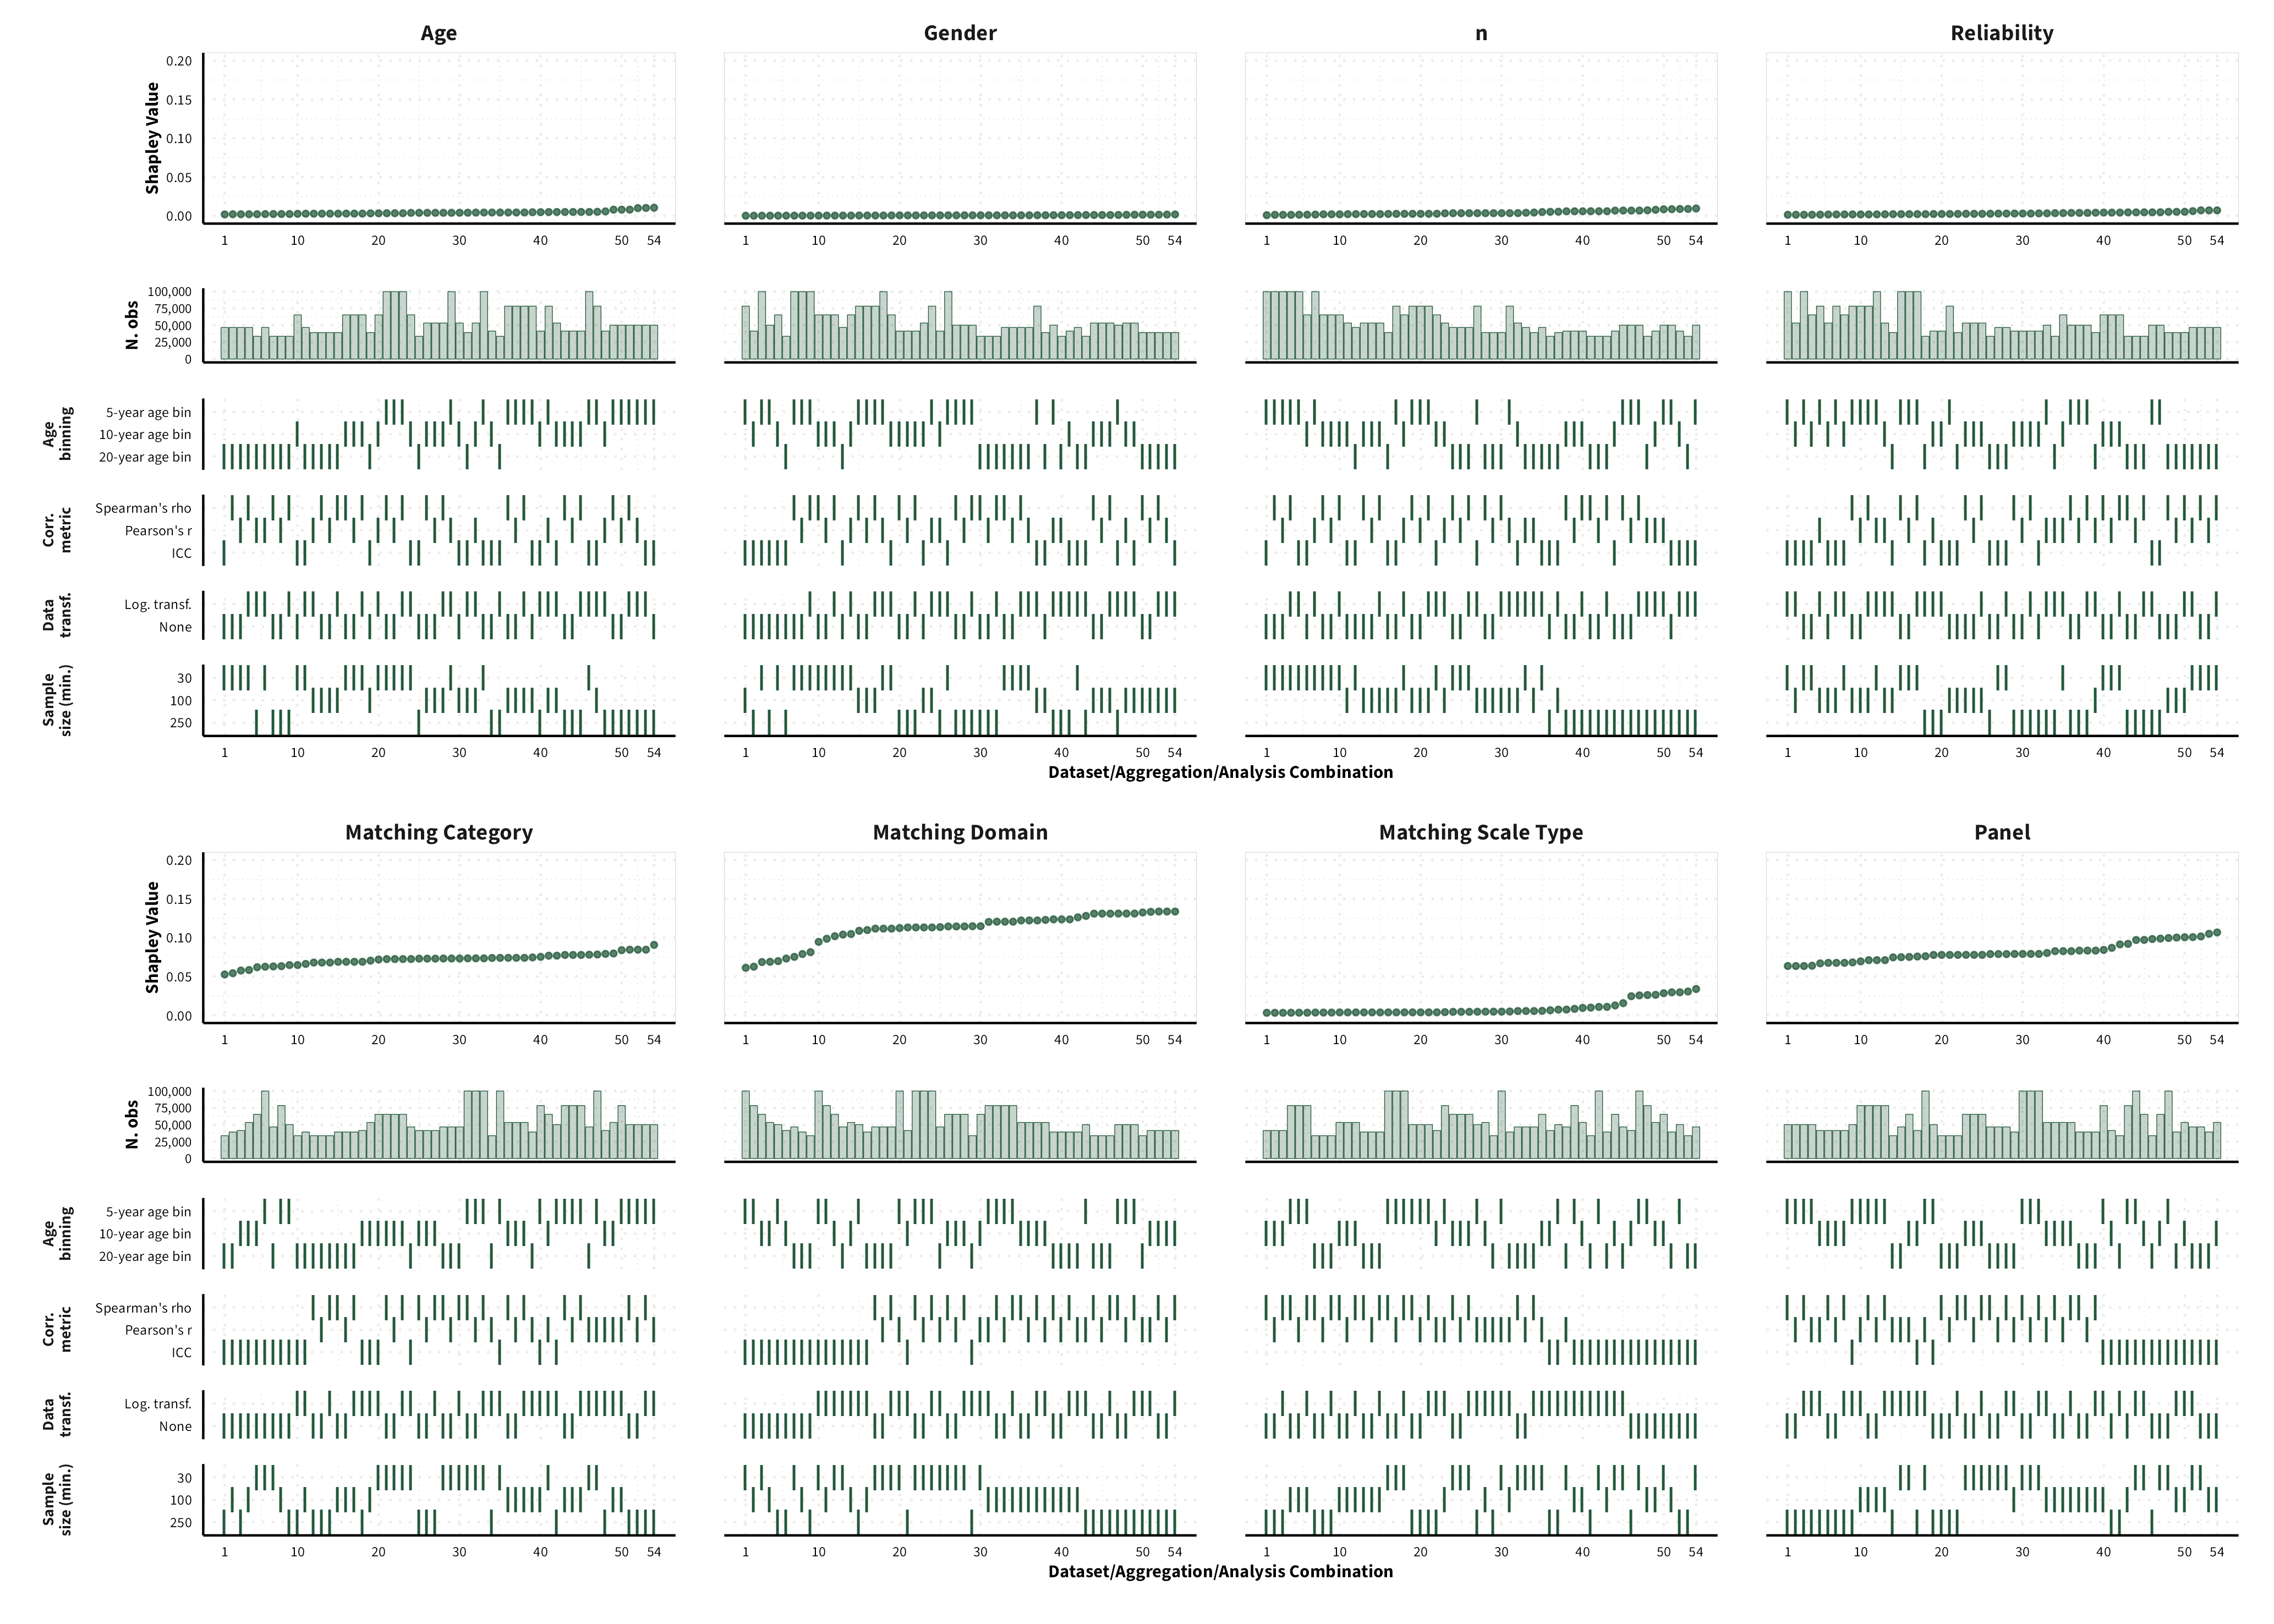
We were unable to estimate Shapley values for certain data sets, given that certain data points would be removed from the dataset, and we would therefore encounter either issues related to singularities or lack of levels in a categorical variable. As a result, the number of possible dataset configurations vary between measure categories.
Omnibus
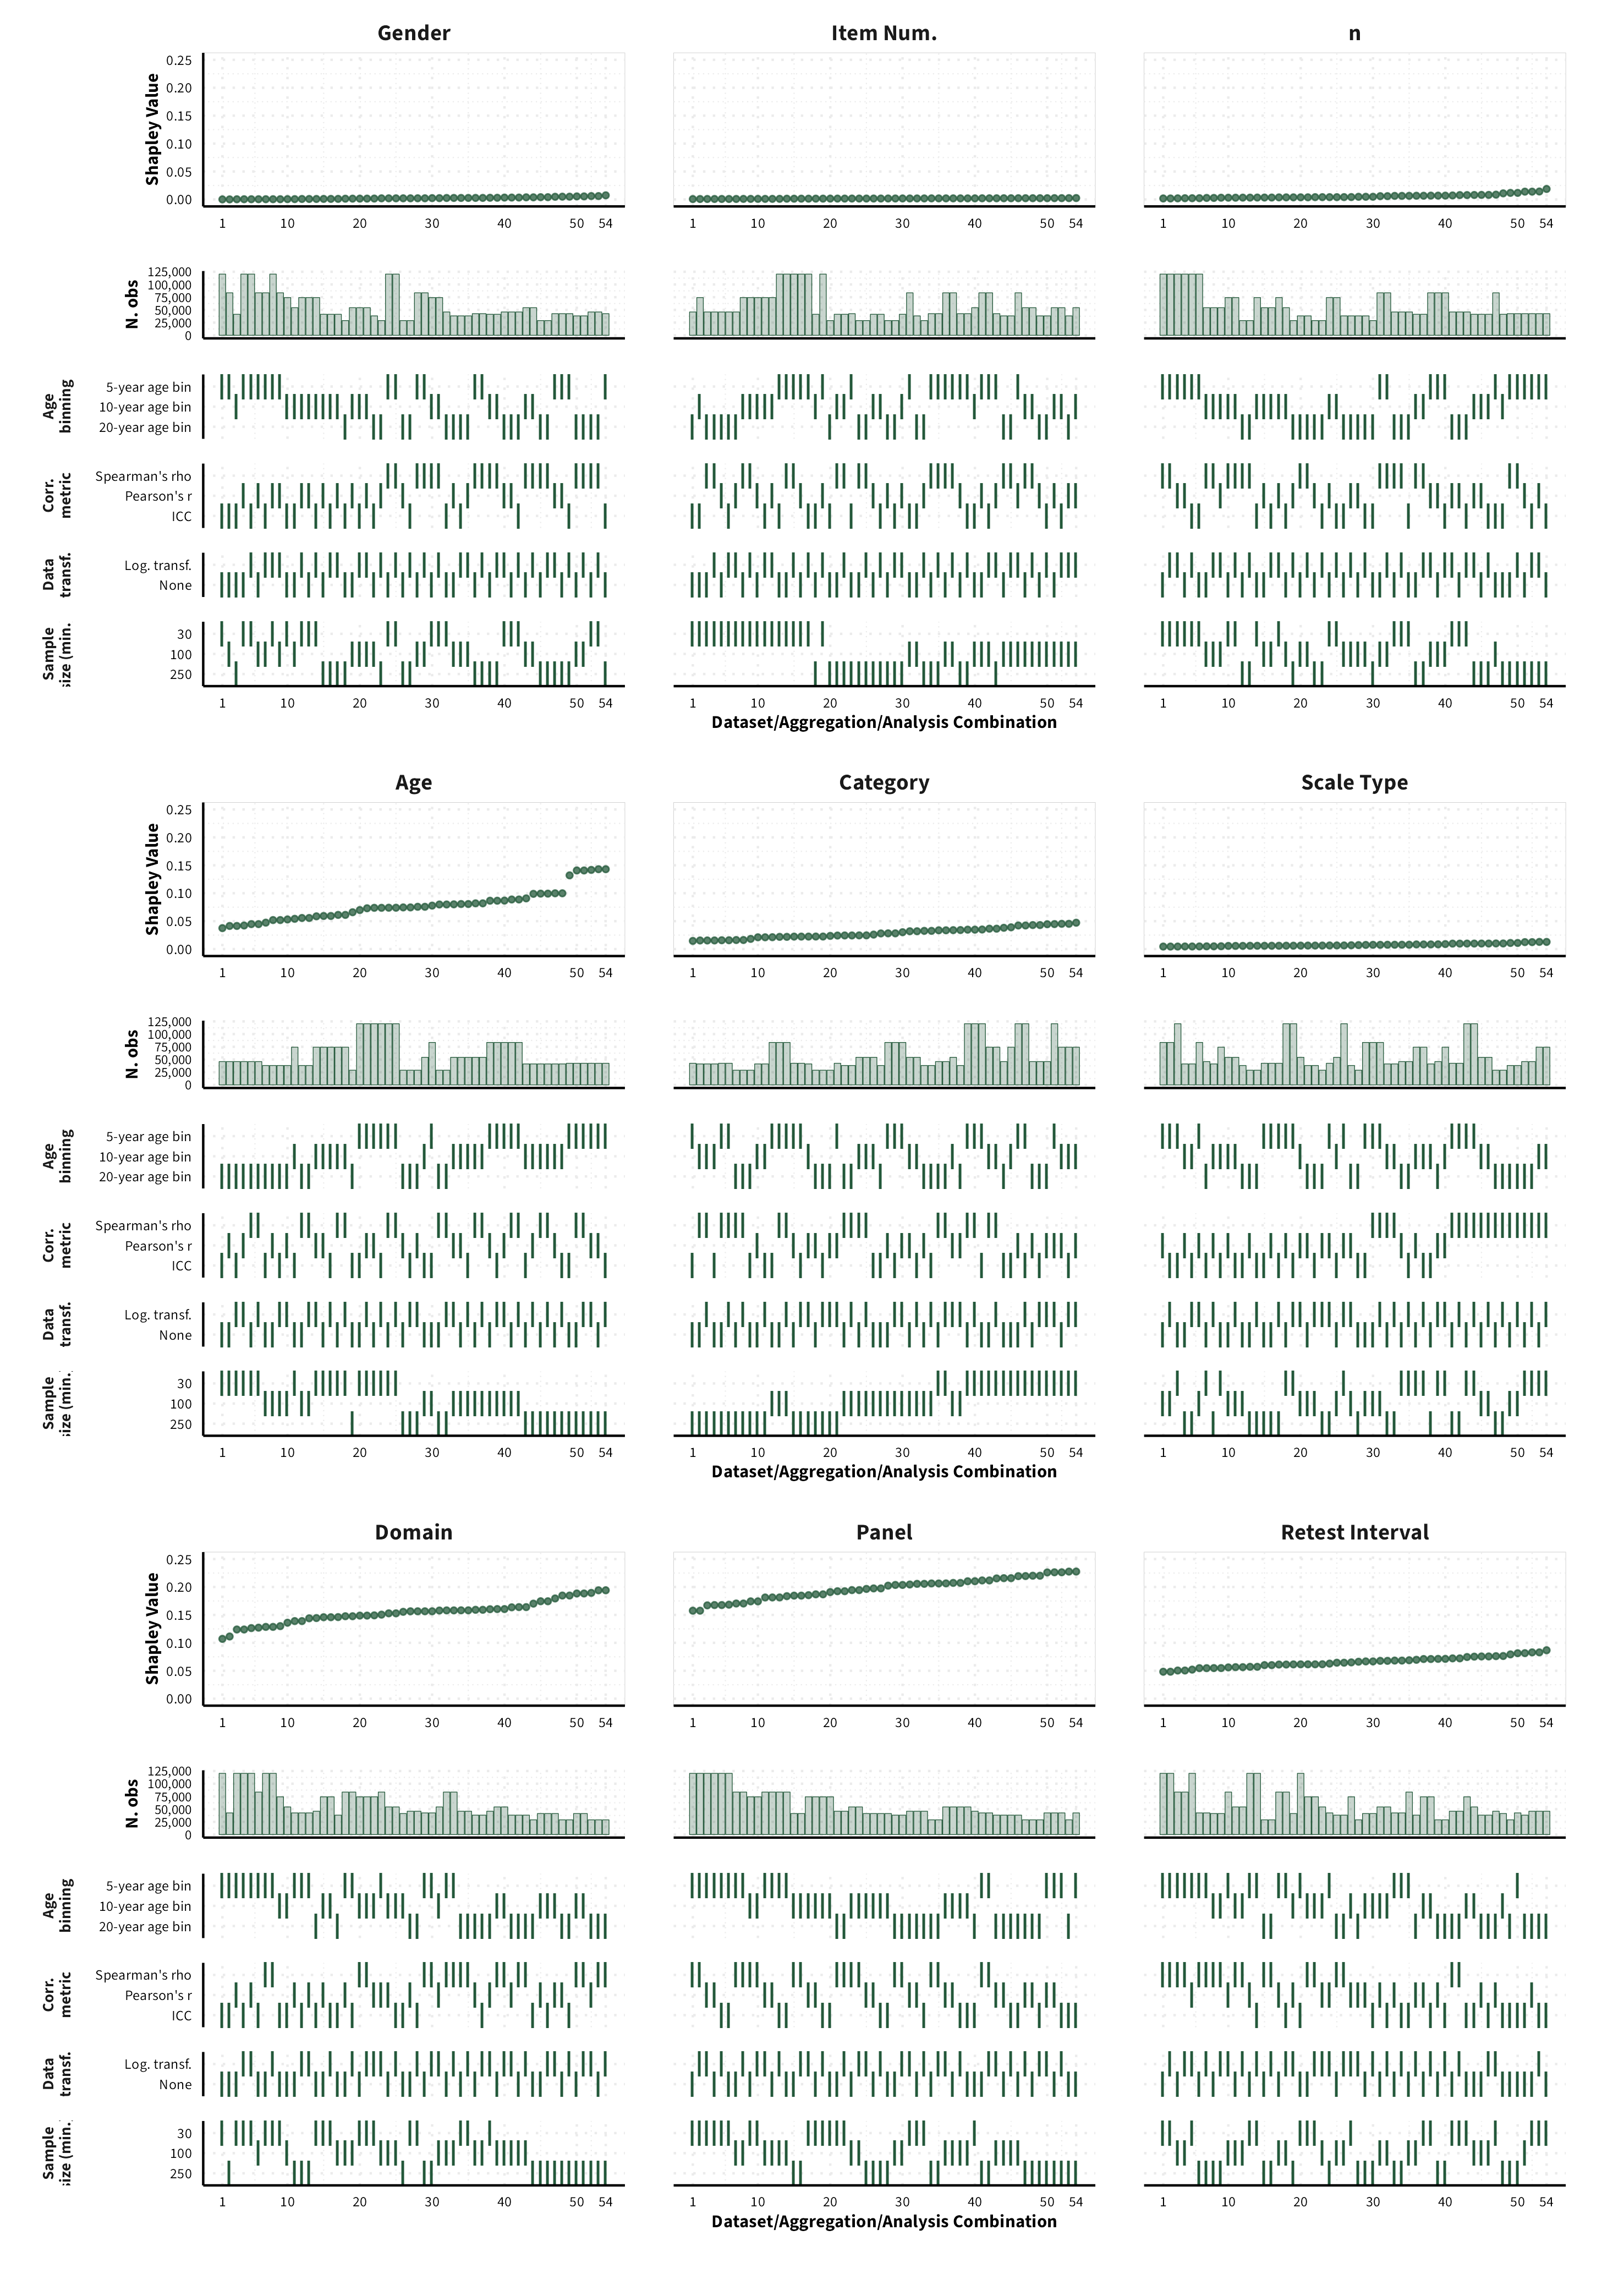
Propensity
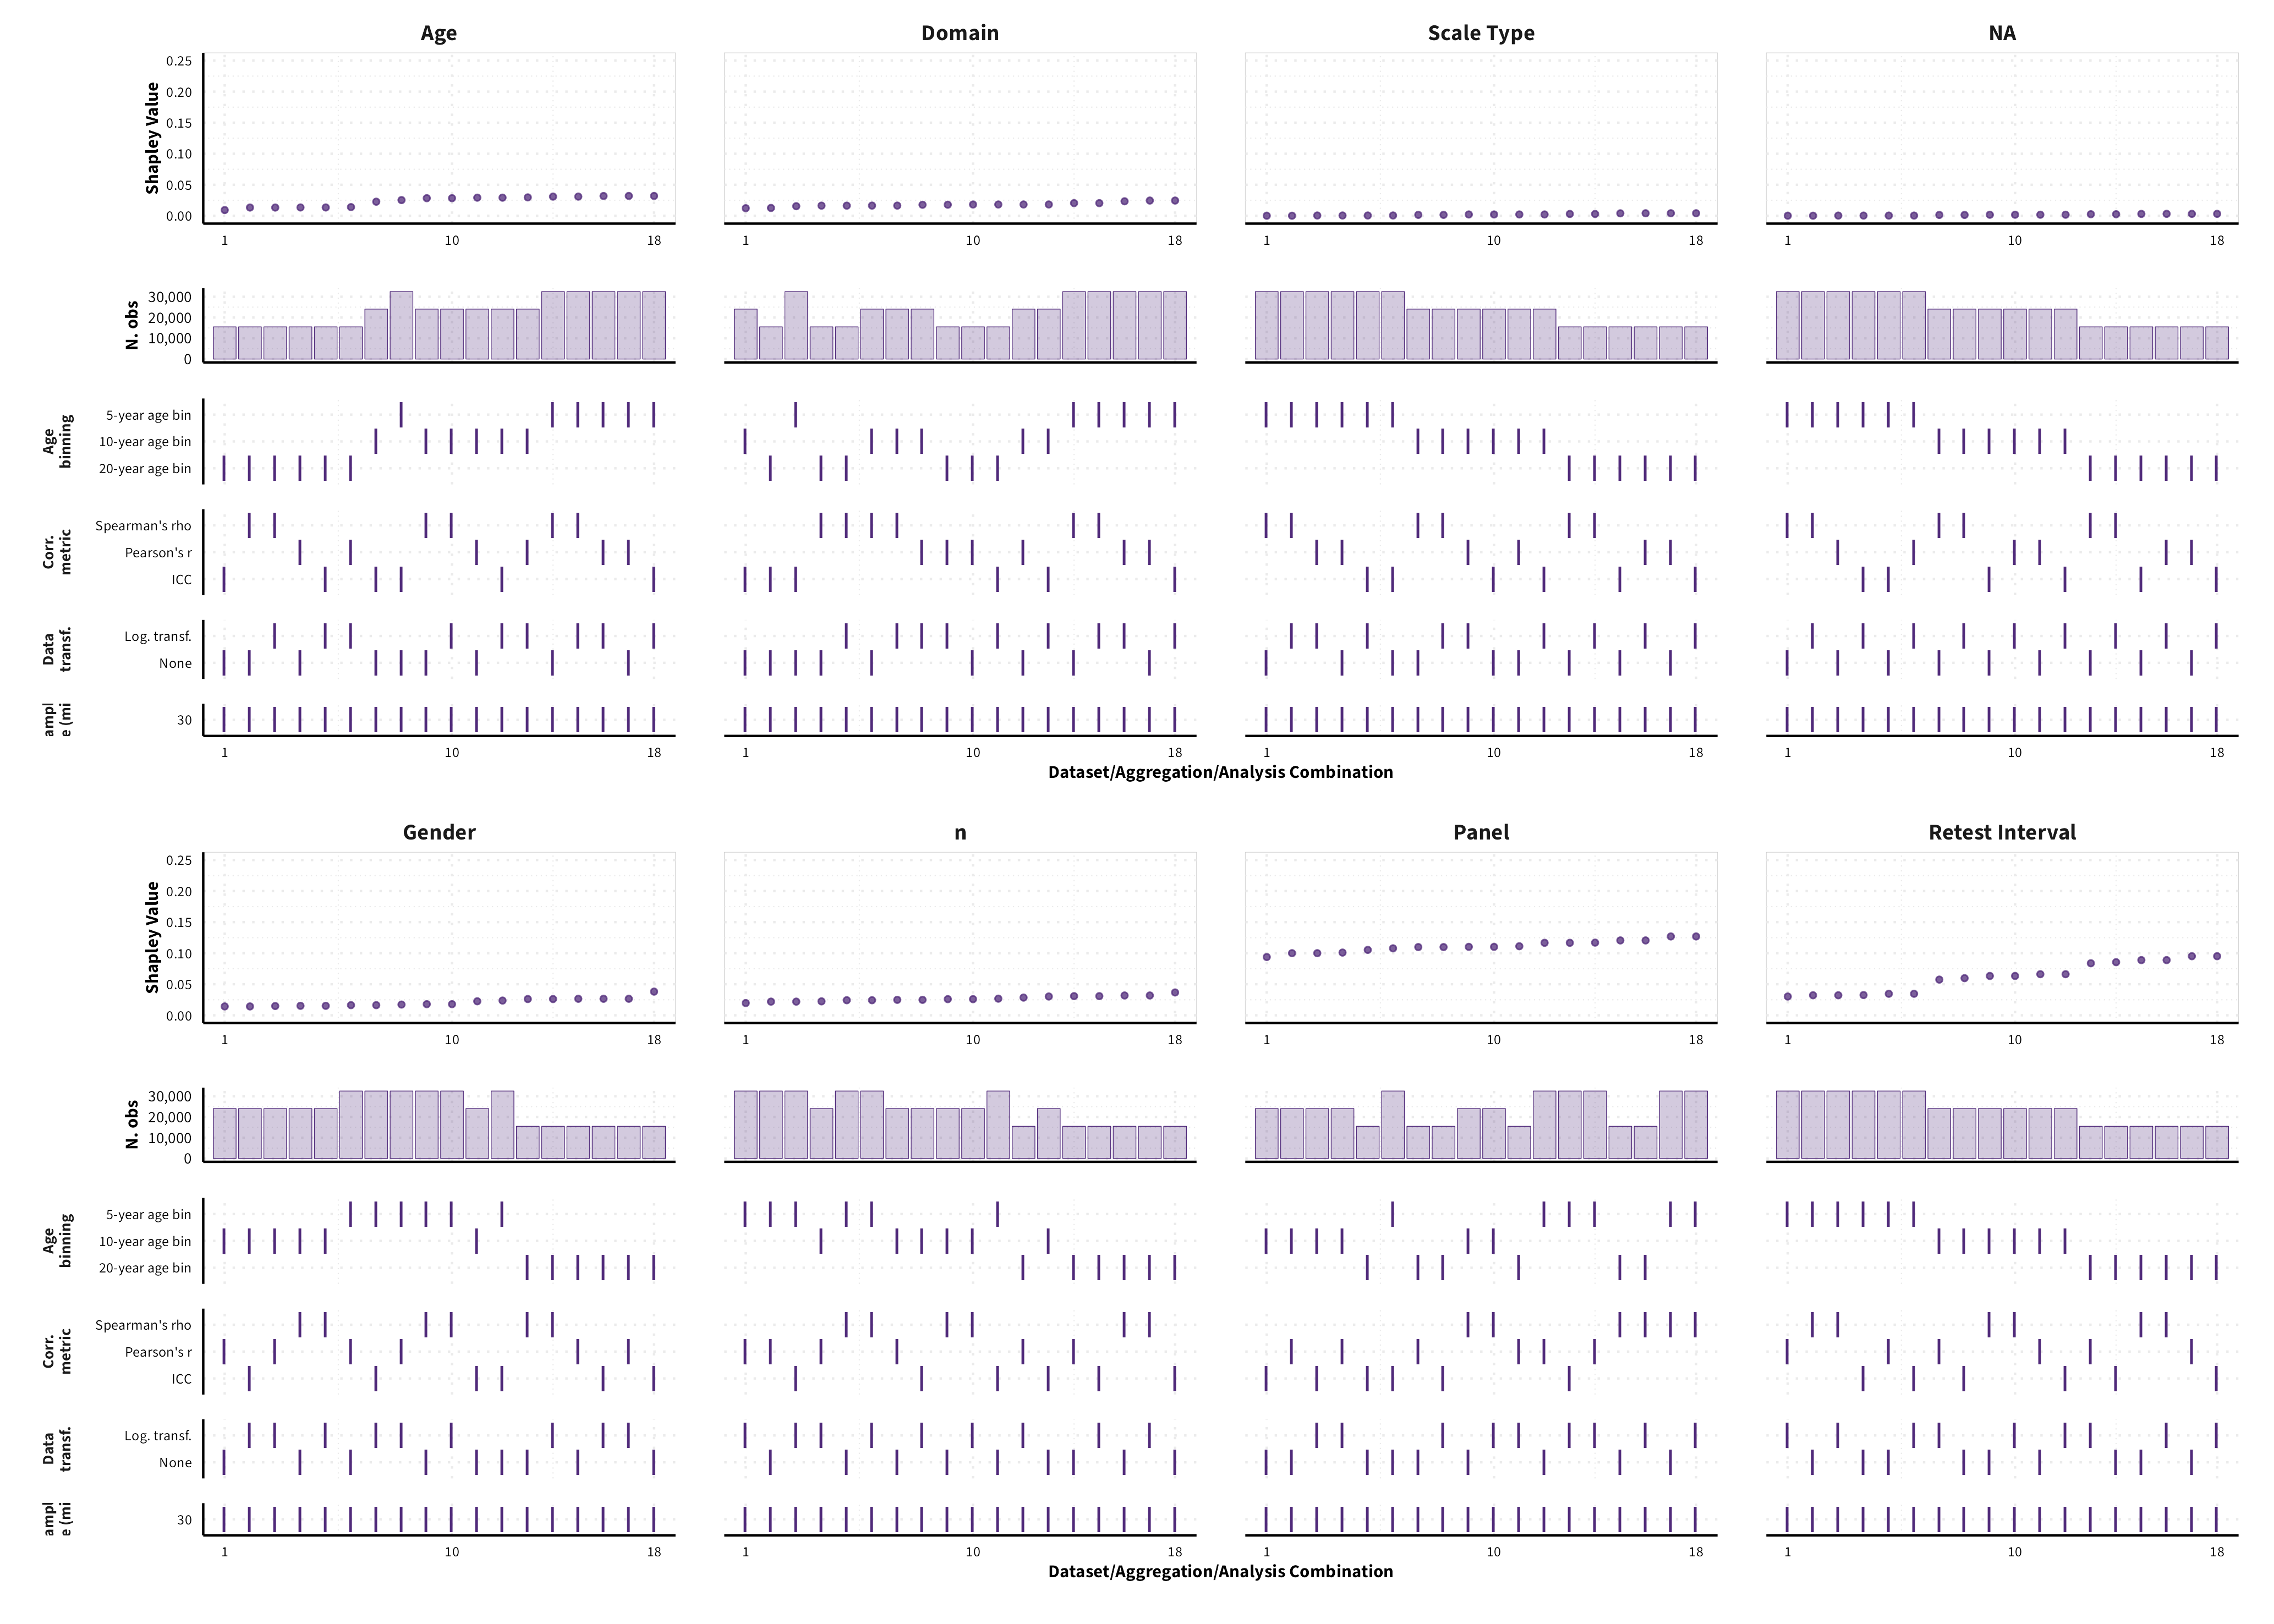
Frequency
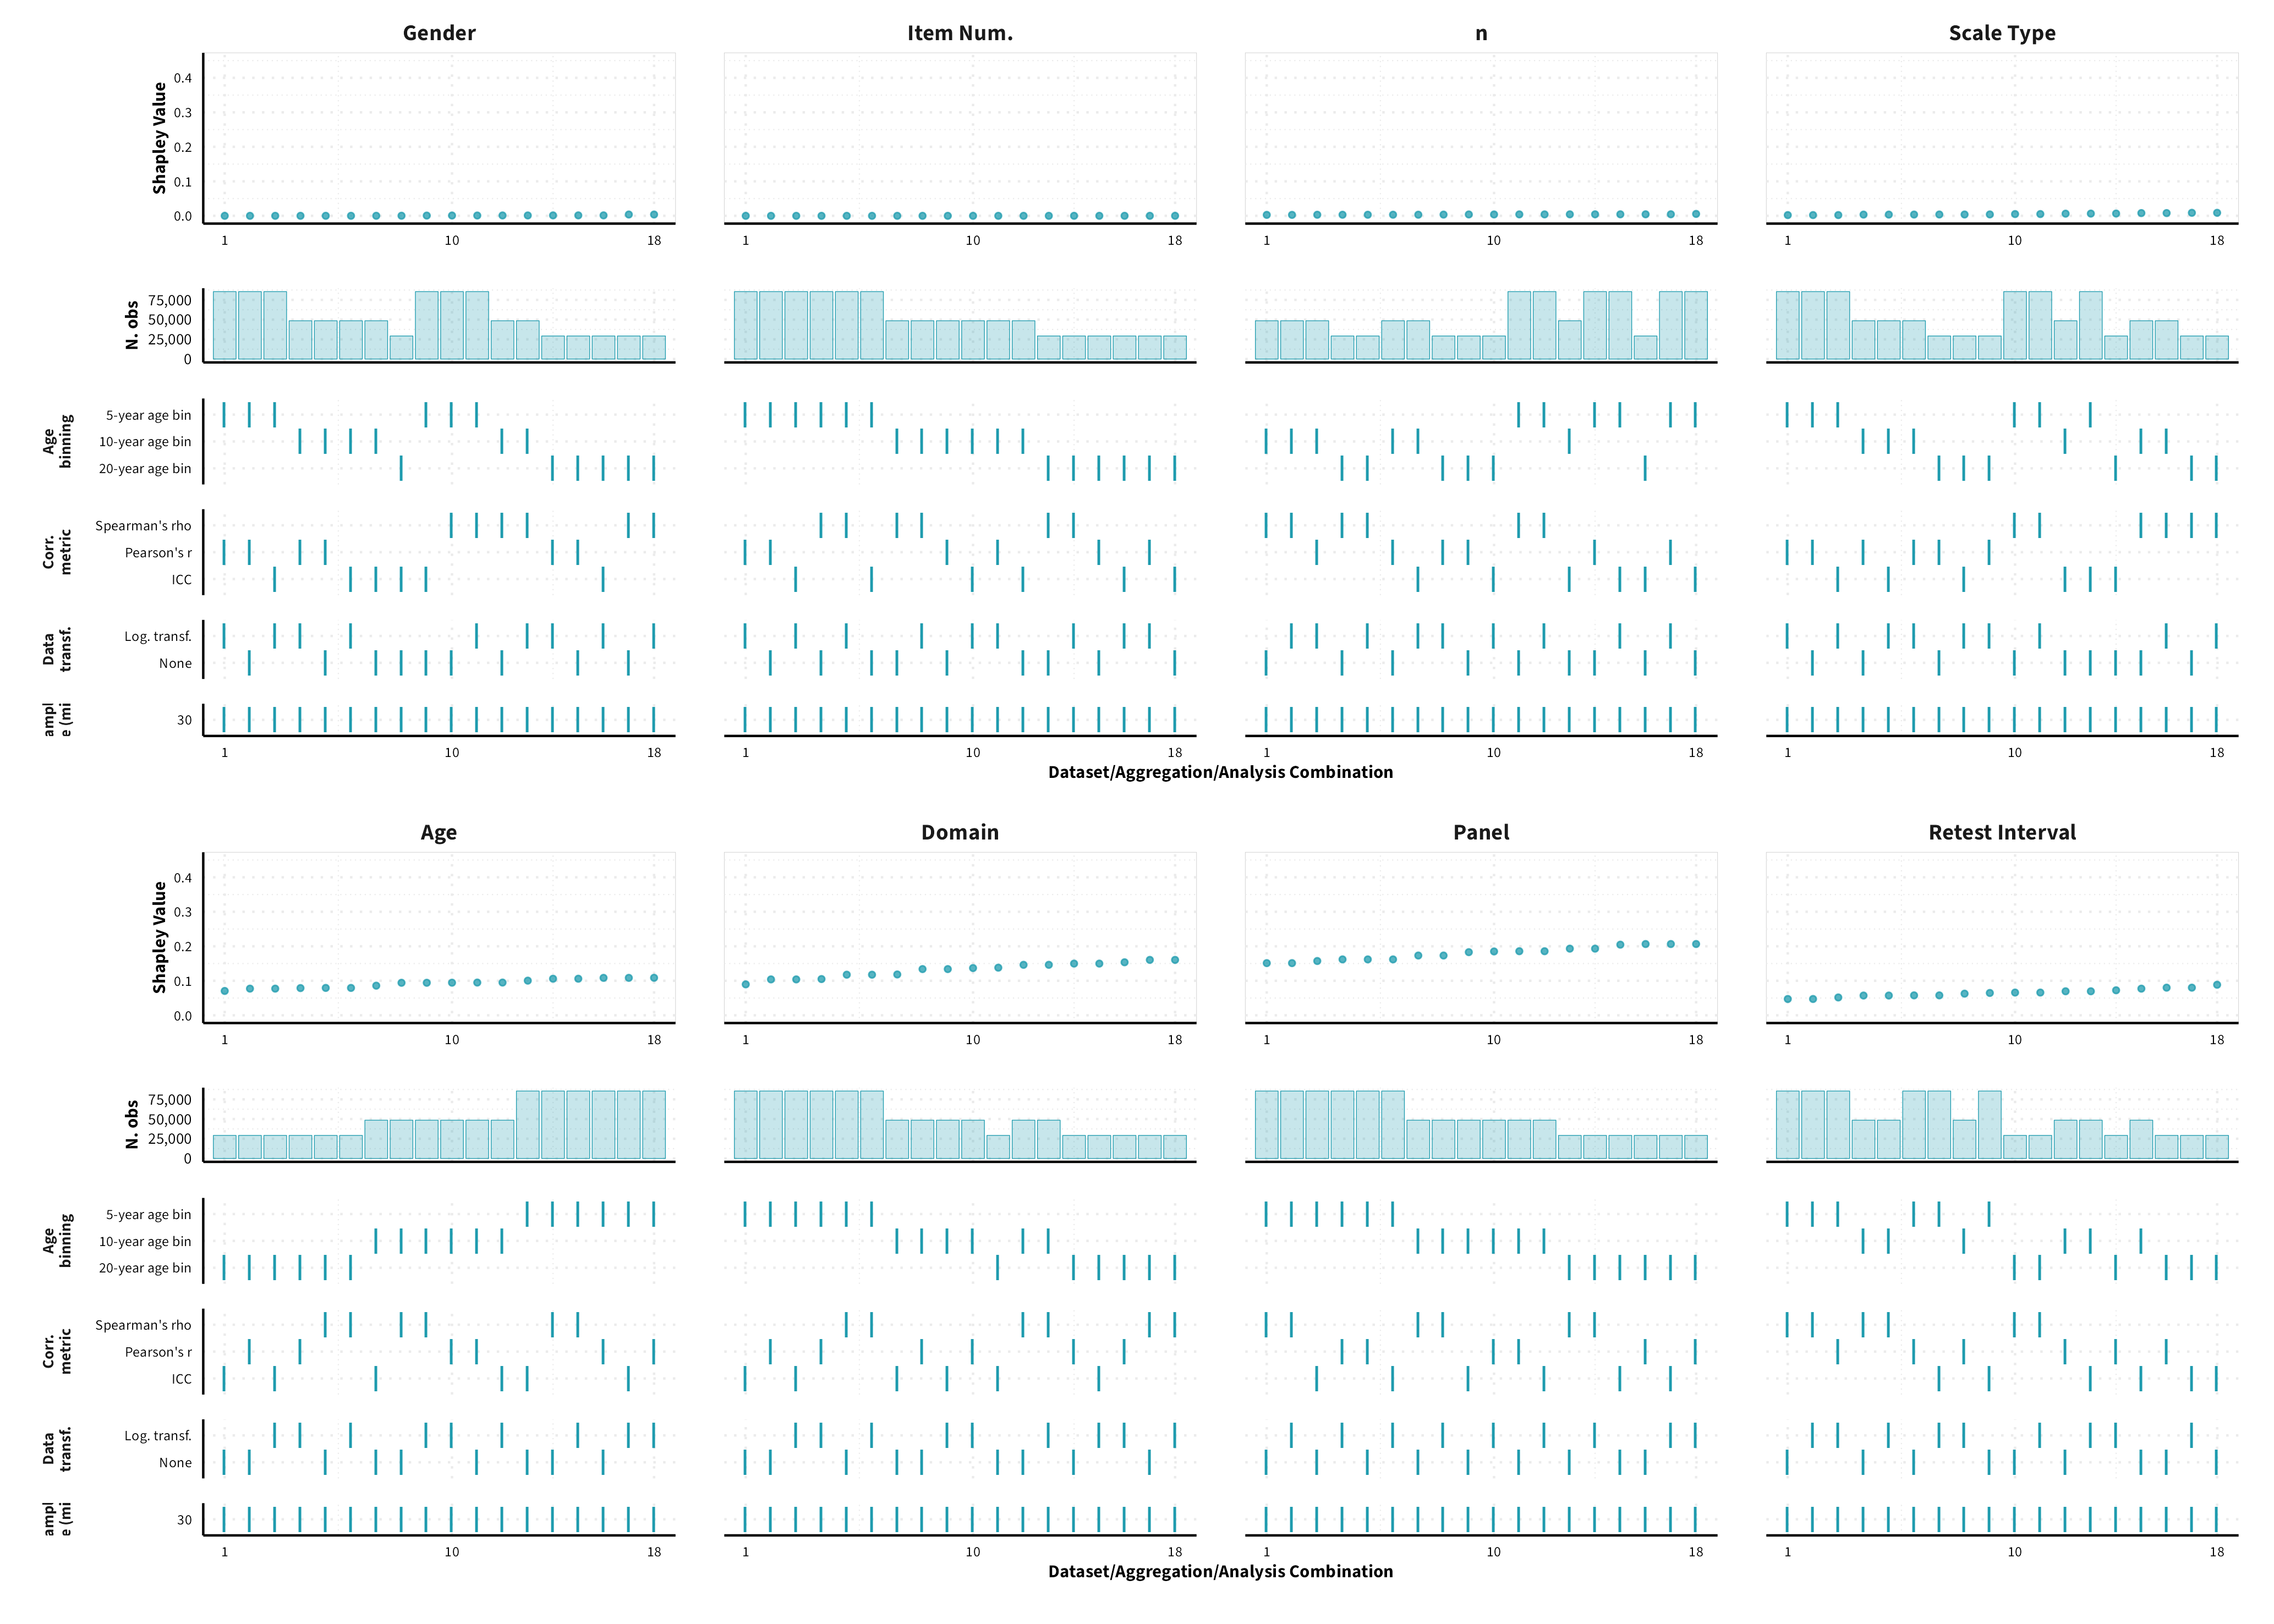
Behaviour
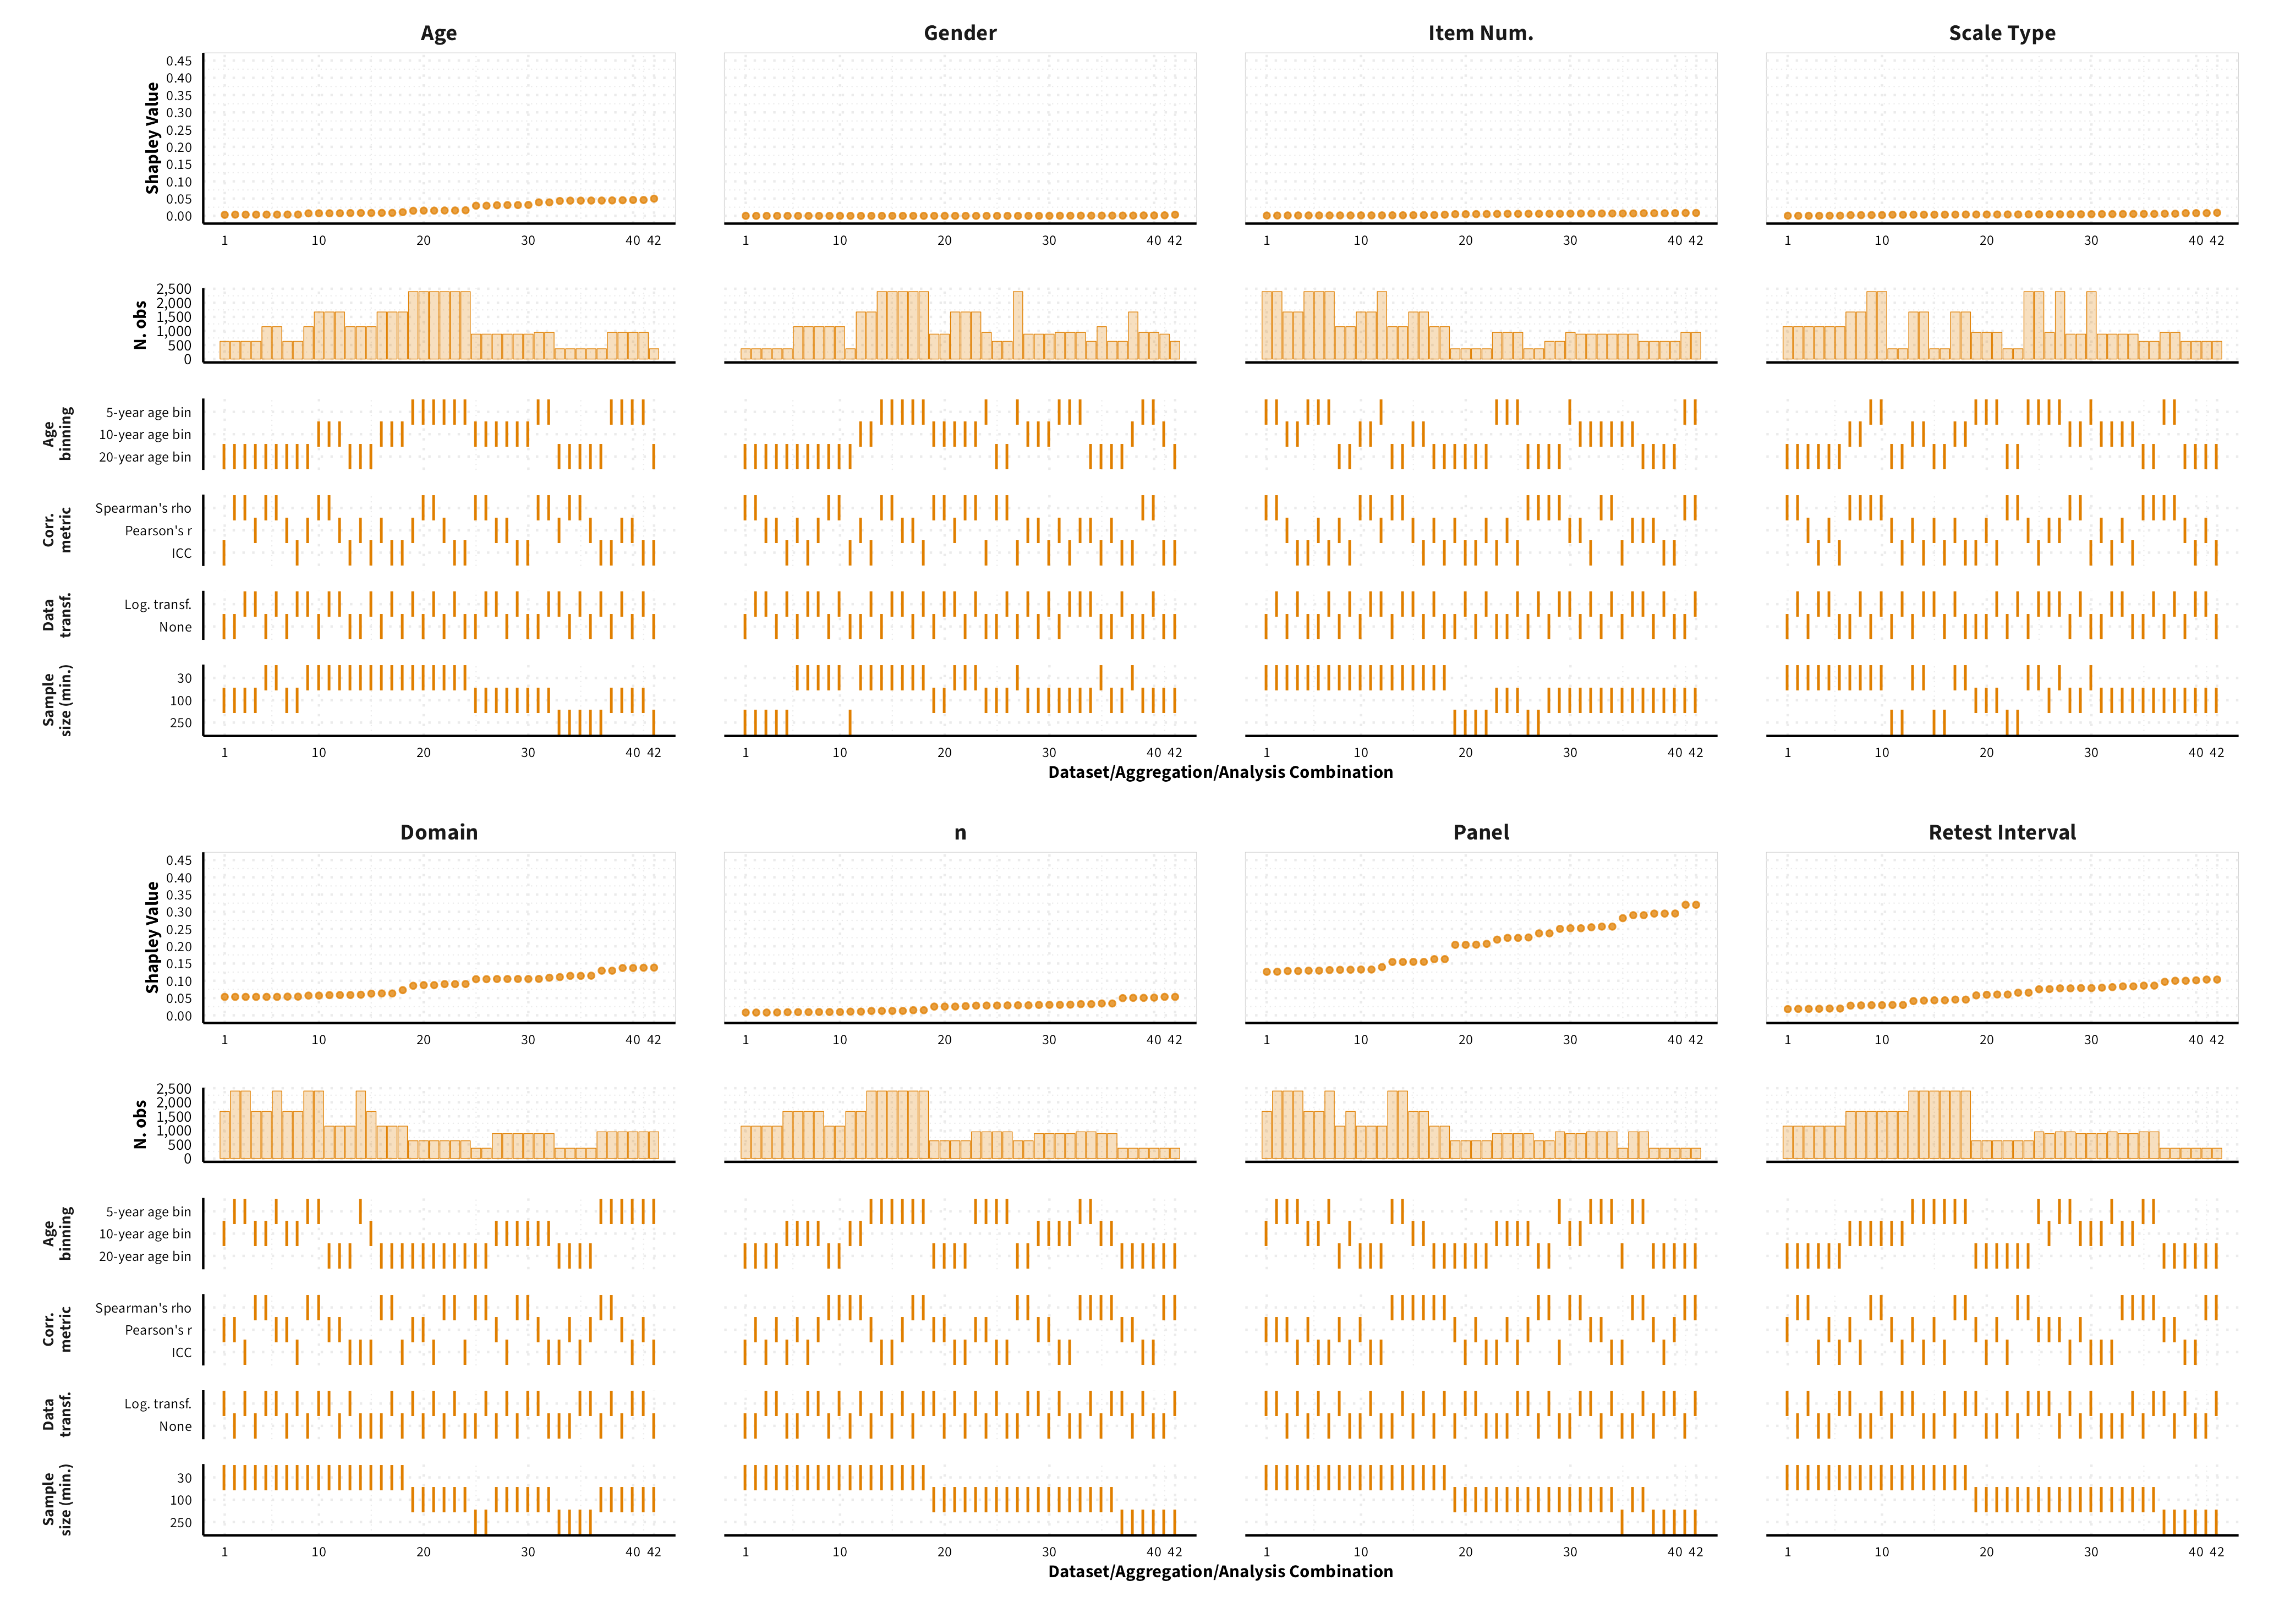
Meta-Analytic Stability and Change model
Predicted MASC parameter estimates (mean and 95% HDI) for each measure category and domain of risk preference for a sample of 40-year old individuals (50% female) across different data formats (visualizing for each measure category a subset of 1’944 possible specifications)
Propensity
Driving
Ethical
Gambling
General Risk
General Health
Investment
Occupational
Recreational
Frequency
Alcohol
Driving
Drugs
Ethical
Gambling
Occupational
Sexual Intercourse
Smoking
<
Behaviour
Gambling
Insurance
Investment
Occupational
Convergent Validity
Variance Decomposition
We were unable to estimate Shapley values for certain data sets, given that certain data points would be removed from the dataset, and we would therefore encounter either issues related to singularities or lack of levels in a categorical variable.
Meta-Analysis
Overall
By Measure Pairs
Behaviour-Behaviour
Frequency-Behaviour
Frequency-Frequency
Propensity-Behaviour
Propensity-Frequency
Propensity-Propensity
Social