6.1 Explore your data
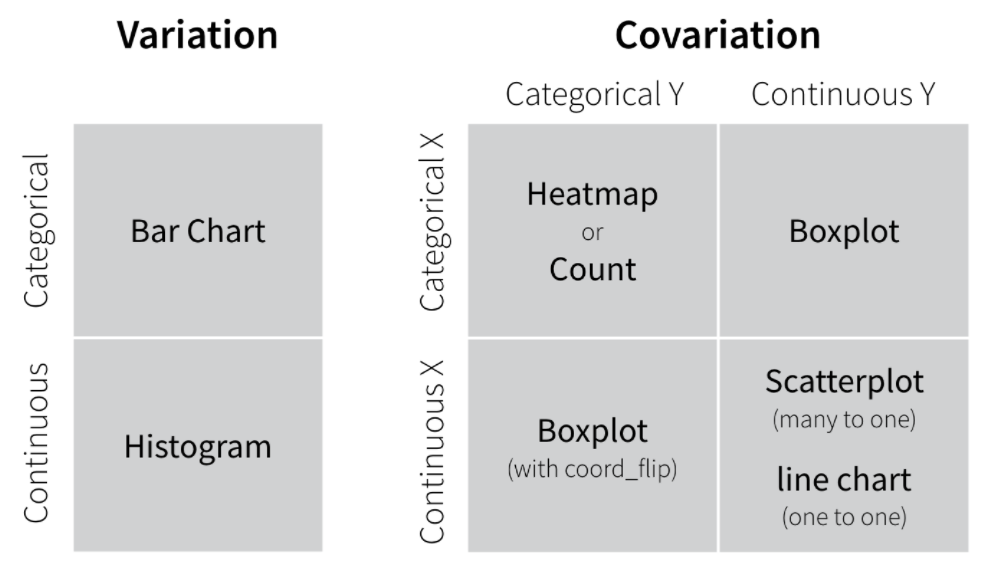
In this module, you will learn how to use ggplot2 to visualize patterns within values and relationships between variables. You will first learn Exploratory data analysis or EDA, a way to use visualization and transformation to explore your data systematically.
Go through the RStudio Primer on Exploratory Data Analysis and think about possible graphics that you can employ for EDA in your own master project.
There are no additional assignments for this session.