Hackathon
The group hackathon aims to use data visualization to understand how people perceive technological and societal risks, from nuclear power to artificial intelligence!
Participants will work in small groups of 4 to 5 people to produce data visualizations with the goal of understanding risk perception, in particular, exploring the potential of novel semantic models to predict risk perception and how well these fare relatively to the classic psychometric model (cf. Fischhoff et al., 1978).
In what follows, we first provide an overview of the available data, and, second, provide a set of tasks that the groups are asked to complete. The tasks have been designed to offer both an overview of the data as well as a training opportunity in data wrangling and data visualization using R. Each group can, in addition, and time permitting, use the data set to create additional visualizations or analyses that can shed light on the topic of risk perception - the sky is the limit!
Data
We will use data from an ongoing project by Zak Hussain, Dirk Wulff, and Rui Mata that aimed to create the largest data set concerning risk perception to date so as to test novel semantic models of risk perception.
The project stems from a pre-registered study conducted in 2022. The table below provides an overview of pre-processed data stemming from the study that is made available for the purposes of the hackathon. You can find a link to the data here.
Risks and Risk Ratings
| Variable | Description |
|---|---|
word |
1004 risks for which Hussain et al. obtained risk ratings from an online survey. |
cluster |
A categorization of each word/risk into different categories (e.g., Activities/Technologies, Transportation). The clustering was performed using free association data using a standard clustering algorithm. |
risk_rating |
Mean of participant risk ratings given to each word on a scale of -100 (safe) to +100 (risky). |
Psychometric Model
The following variables represent mean responses given on 7-point likert scale to the associated questions in the online survey:
| Variable | Description |
|---|---|
psych_voluntary |
Are individuals exposed to this risk voluntarily or involuntarily? (1=voluntary, 7=involuntary) |
psych_fatal |
How fatal are the consequences of this risk? (1=not-fatal, 7=fatal) |
psych_immediate |
Is death from this risk immediate or delayed? (1=immediate, 7=delayed) |
psych_dread |
Is this a risk that individuals can reason about calmly or is it one that they have great dread for? (1=calm, 7=dread) |
psych_catastrophic |
Is this a risk that kills one person at a time (chronic) or a risk that kills large numbers of people at once (catastrophic)? (1=chronic, 7=catastrophic) |
psych_controllable |
Is this risk controllable or uncontrollable for the individual exposed to this risk? (1=uncontrollable, 7=controllable) |
psych_known_sci |
Is this risk known or unknown to science,Is this risk known or unknown to the individuals exposed to this risk? (1=Known, 7=Unknown) |
psych_known |
Is this risk known or unkown to the individuals exposed to this risk? (1=known, 7=unkown) |
psych_new |
Is this risk new or old? (1=new, 7=old) |
| ‘psych_pc[1-9]’ | 9 principle components obtained via principle component analysis of the above psychometric dimensions |
in_Fisch |
Boolean indicating whether the word is contained in Fischhoff et al. (1978). |
psych_pred_risk |
Predicted riskiness of each word according to 9 psychometric dimensions (above) |
Semantic Models
The following are predictions from GloVe and SWOW semantic models that were trained on online text or free association data, respectively.
| Variable | Description |
|---|---|
glove_pred_risk |
Predicted riskiness of each word according to an embeddings model trained on online text data (GloVe) |
swow_pred_risk |
Predicted riskiness of each word according to an embeddings model trained on free association data (SWOW) |
Tasks
The first task should be for you to get some intuitive understanding of the distribution of ratings and the associated psychometric dimensions. How riskily are the different categories of risks (e.g., techonolgical, transportation, health) perceived? How much variance is there within each category? Consider using visualization of distributions, for example, using density plots.
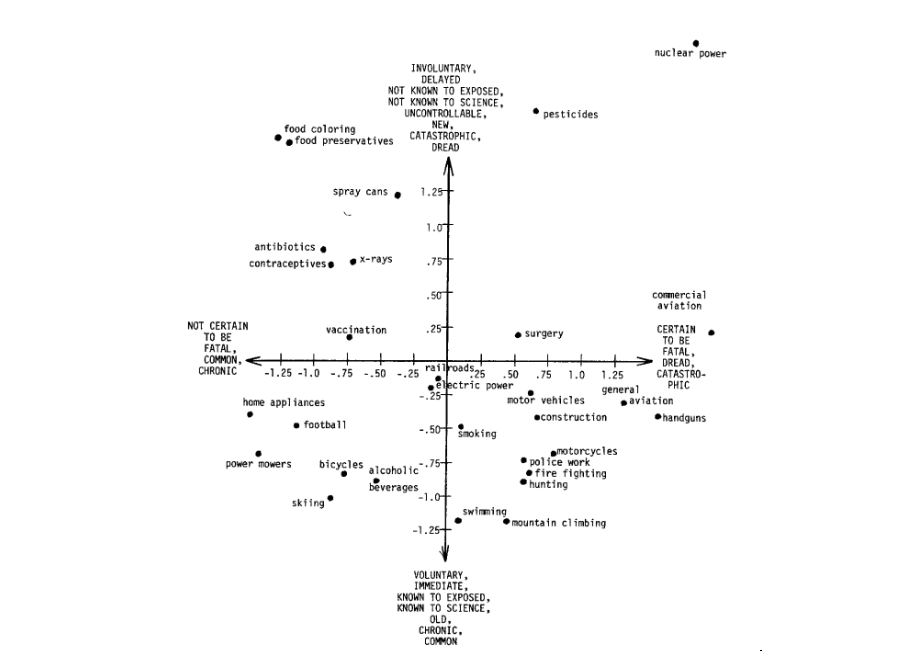
To what extent do the risk perception results match the classic findings on risk perception? Does a two-dimensional visual representation of risks match well the patterns by Fischhoff et al. (1978)?
Bonus Task: How might you label psych_pc1 and psych_pc2 to make them interpretable? Which of the original 9 psychometric dimensions do the 2 principle components relate to the most?
- How well does the psychometric paradigm capture risk perception and how do the semantic models fare in comparison? Consider using scatter plots to examine the correlations between model predictions.