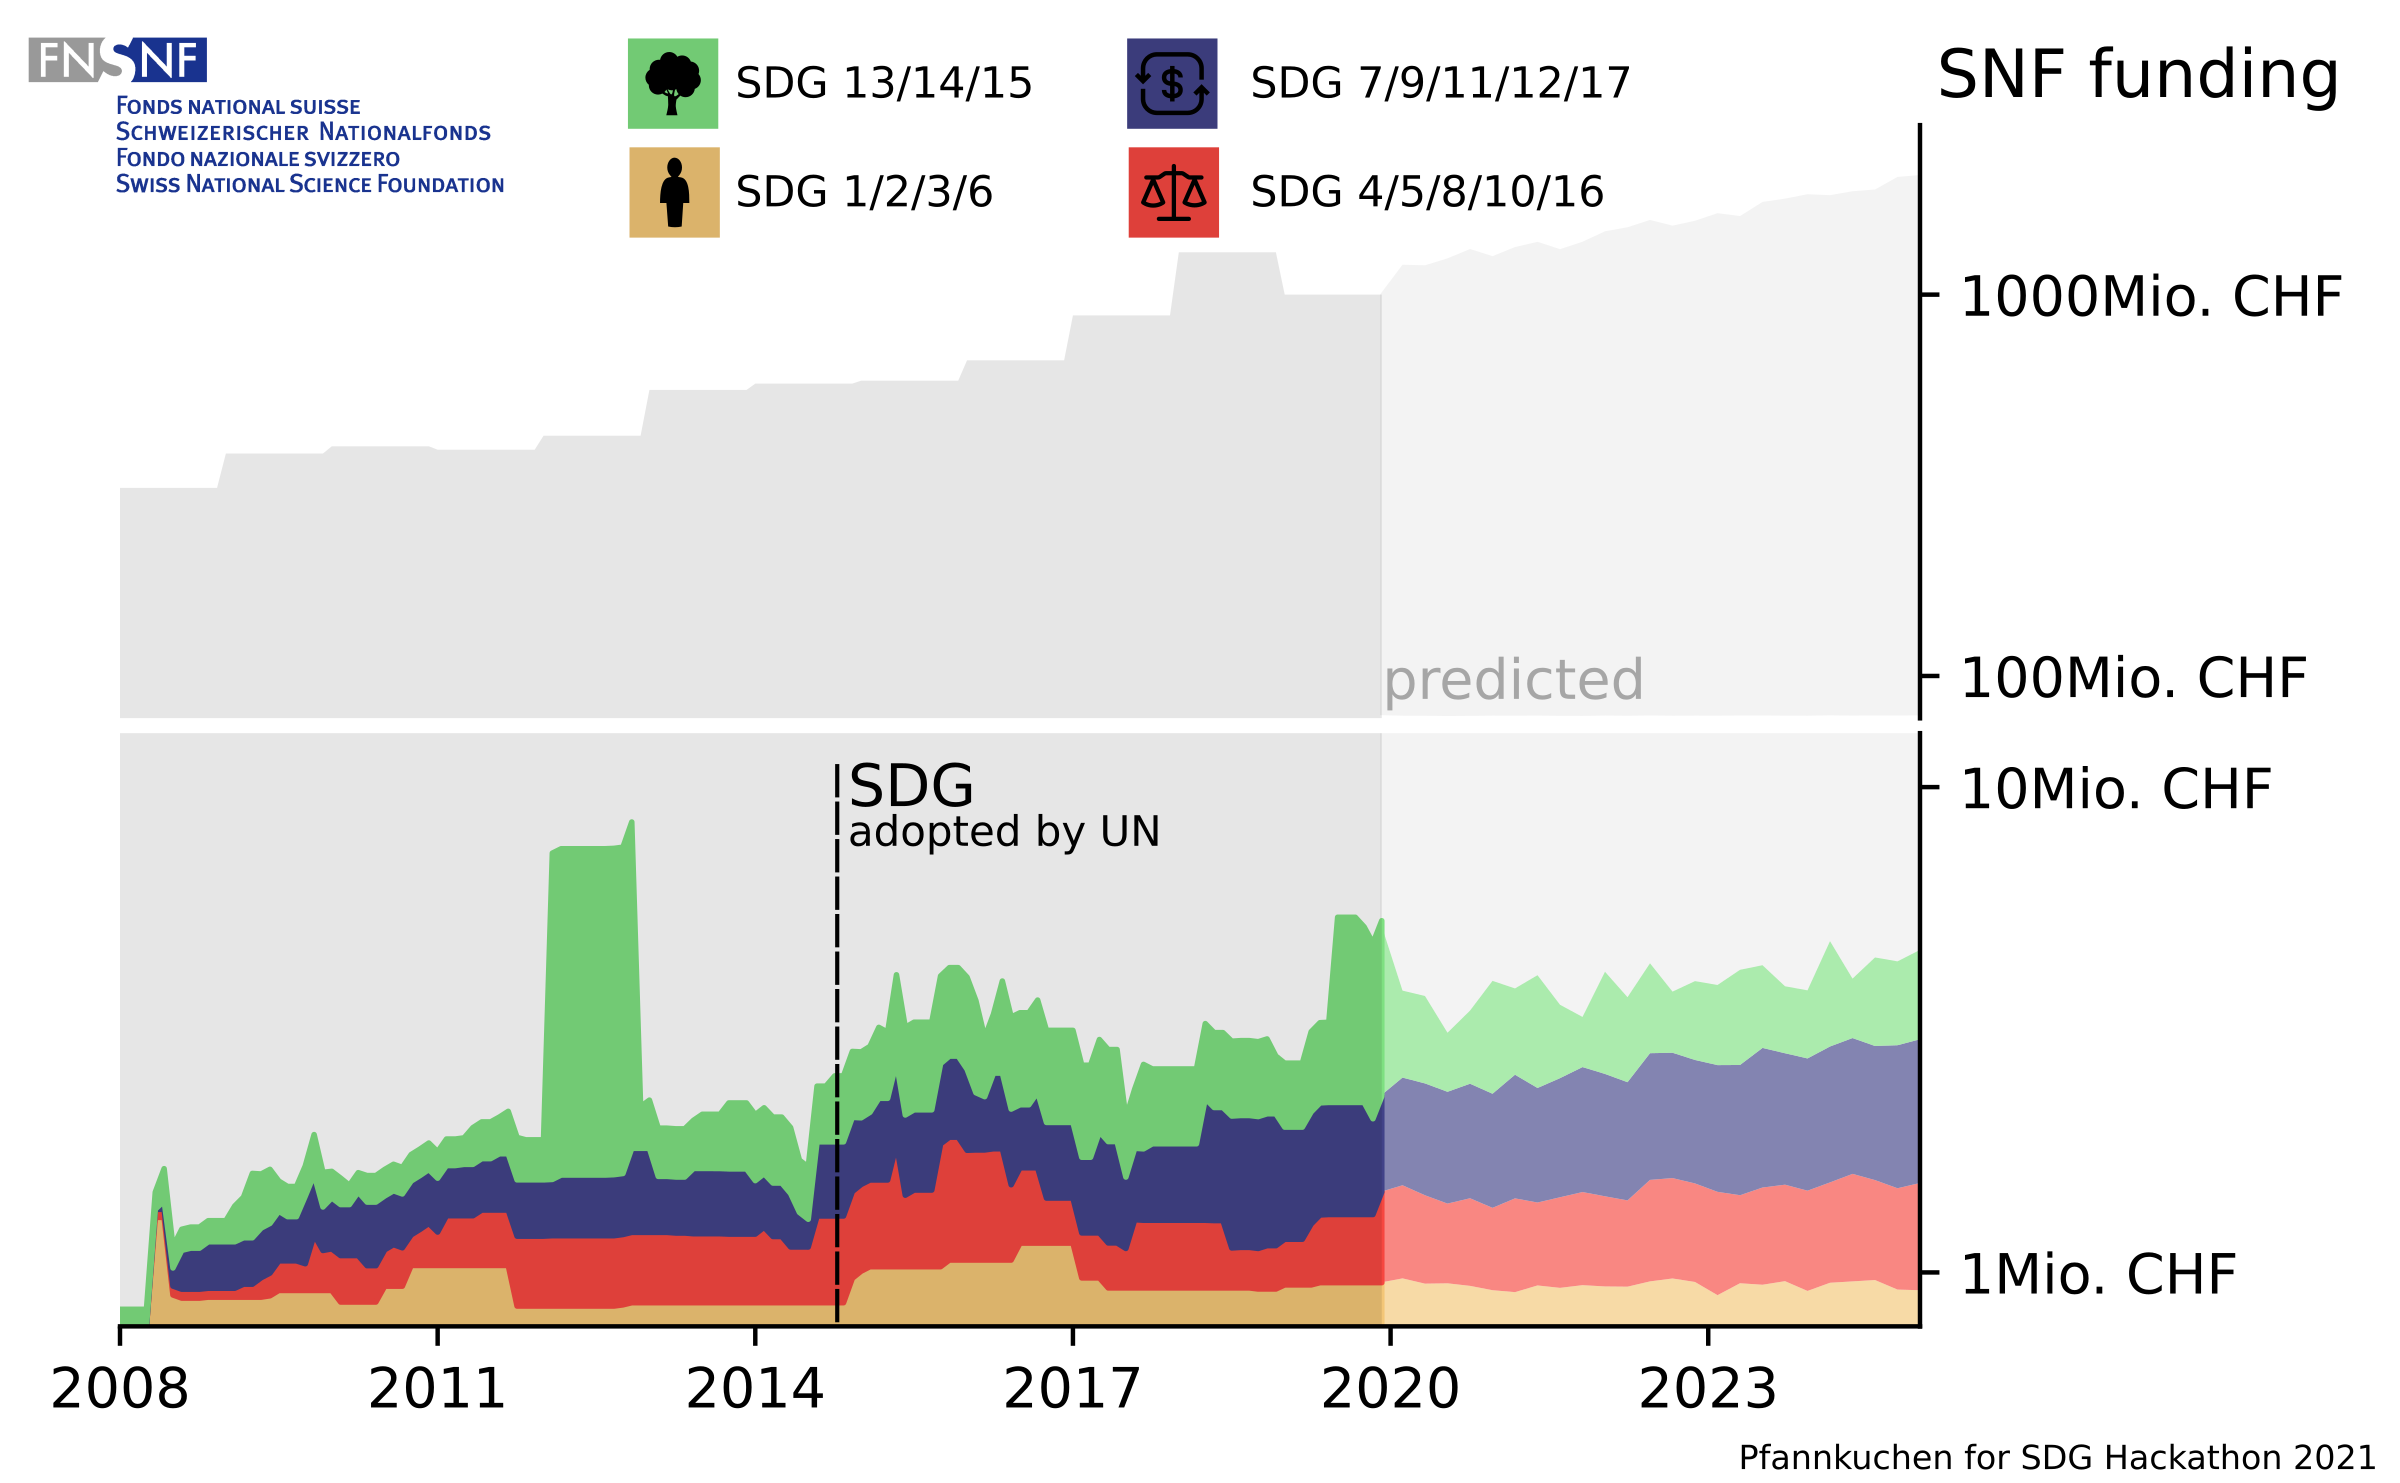
This page presents two galleries of visualizations submitted to the jury and public competitions of the SDG Hackathon: Visualizing Swiss Sustainability Research.
The visualizations below are ordered based on the voting results, with the number of points from the voting displayed in the top-right corner of each of the shortlist and finalist visualisations.
In what follows, we describe the voting process for the jury and public awards.
For the jury award, each jury member first distributed ten points (max. 3 per visualization) between all submissions and then rated the ten finalists with the most points on four dimensions—innovativeness, attractiveness, story, and hackathon goals. The sum of the four ratings is displayed in the top-right corner of each shortlist and finalist visualizations.
For the public award, participants assigned one point to up to five submissions. The number of points received is presented in the top–right corner of the visualizations.
Follow these links to learn more about the hackathon goals and the data.
All visualizations are published under the CC by 4.0 license.


